


|
|
GP1287 VFD Display |
x 1 | |
|
|
Arduino Nano R3 |
x 1 | |
|
|
Rotary Potentiometer, 10 kohm stereo |
x 1 | |
|
|
Resistor 10k ohm |
x 1 | |
|
|
Capacitor 10 µF |
x 1 | |
|
|
5V 2.5A Switching Power Supply |
x 1 |

|
arduino IDEArduino
|
|

|
Soldering Iron Kit |
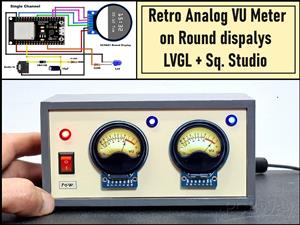
Retro look Analog style VU meter on VFD display with Arduino Nano
A VU meter, also known as a Volume Unit meter, is a device used to display the audio signal level in decibels (dB) in real-time. It is commonly found on audio equipment to help users monitor and control audio levels. The analog VU meter typically consists needle-based indicators that move in response to the audio signal's intensity.

This time I will describe how to make such a device that uses a VFD (vacuum fluorescent display) instead of analog instruments.
In this particular case, the display is a GP1287 with a resolution of 256 by 50 points, and it can be obtained at a relatively cheap price. In one of my previous videos (https://www.youtube.com/watch?v=nvs09OfKzgc&t=18s) I described how to connect such a display to an ESP32 microcontroller, and this time the display is controlled by Arduino.
The device is extremely simple to build and contains only a few components
- Arduino Nano Microcontroller
- GP1287 VFD Display
- 10K potentiometer,
- and two capacitors and resistors
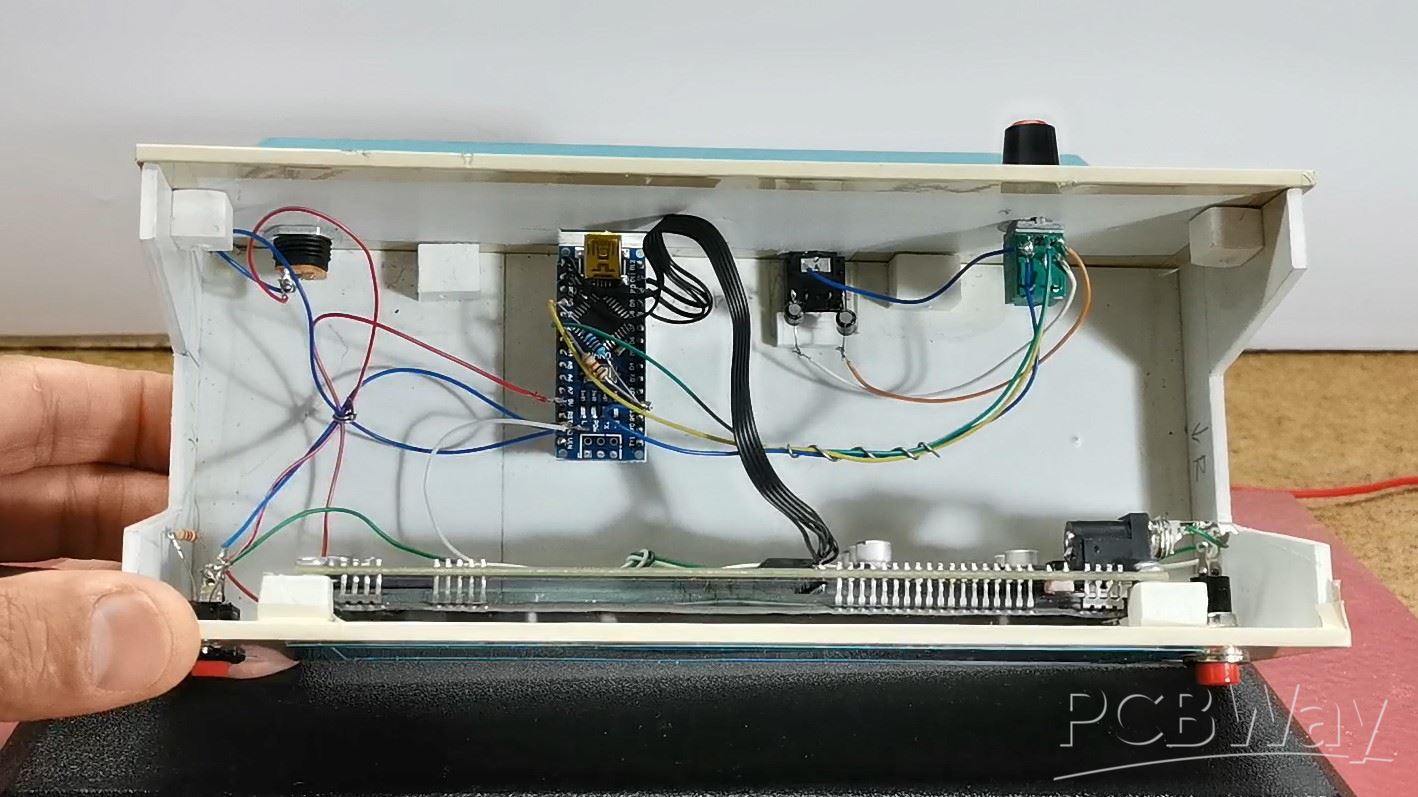
The signal from both audio channels (left and right) is brought to the analog inputs of the Arduino through coupling capacitors.
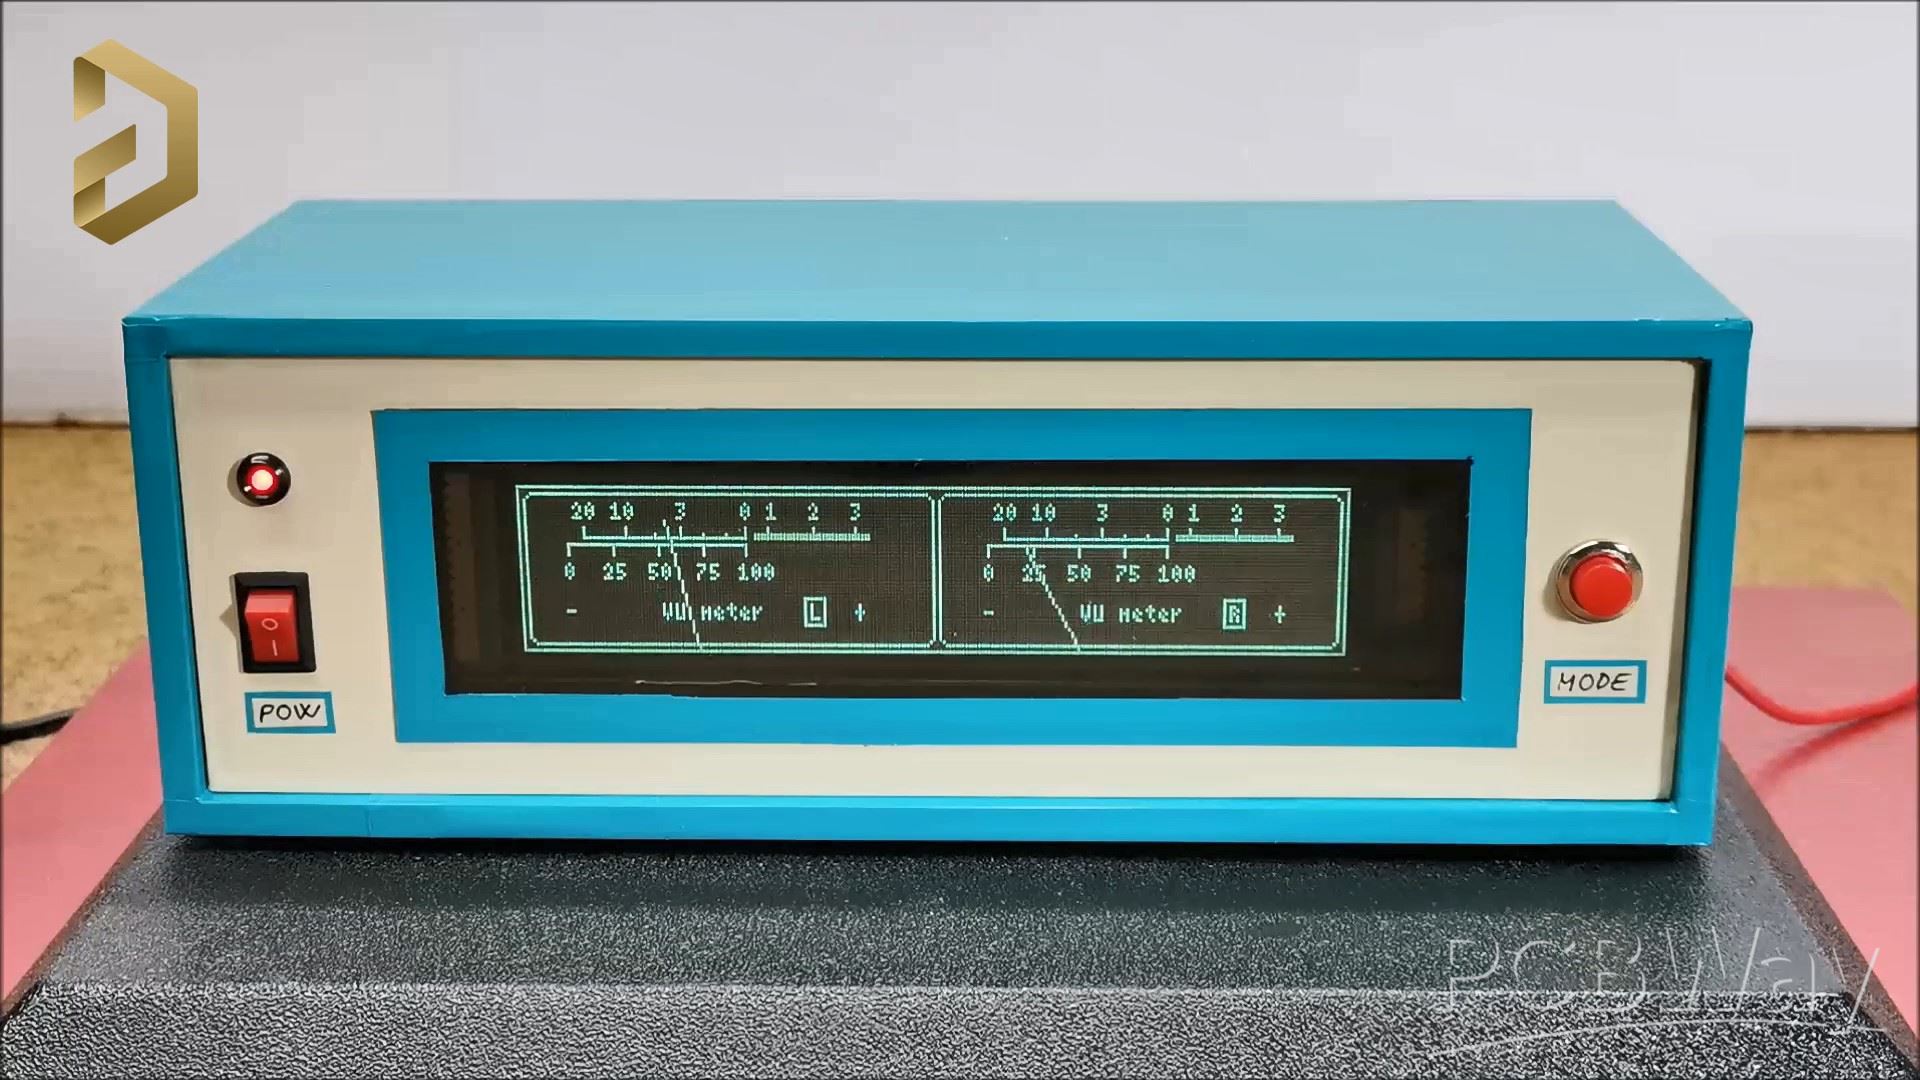
As for the code, I don't have much experience, so feel free to modify and improve it. It is basically based on the U8G2 library, because only this library has support for this kind of VFD display. Also note that when compiling the code you should use the U8G2 library given below. In the first few lines of code we can define the values of Gain, low sound, High Sound, as well as the speed at which the arrow returns to its original position. The sensitivity of the VU meter can be controlled with the potentiometer mounted on the back of the device.
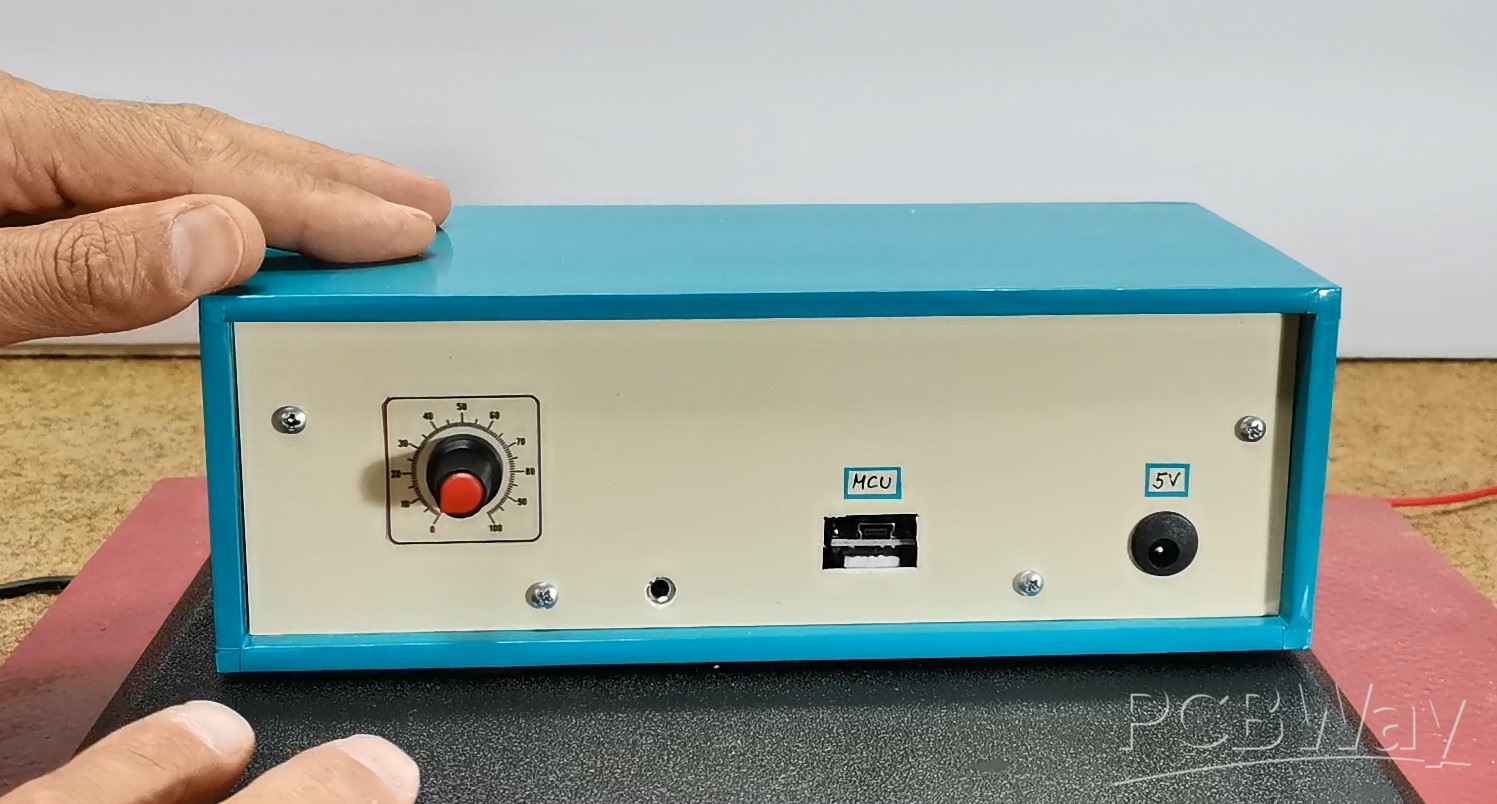
Finally, a short conclusion. I made the device with the intention of explaining to you how you can connect this type of display to an Arduino microcontroller. In actual operation of the VU meter, the slow response of the hands in relation to the input audio signal can be observed, which is a consequence of the display itself, not the microcontroller or the code. Namely, when testing the code I used a 128х64 LCD display instead of a VFD, and the reaction was almost momentary. Due to the relatively high consumption of the display, it is preferable to power it through the power connector of the display itself, which is shown in the picture.

The device is installed in a suitable box made of PVC material with a thickness of 5 mm and covered with colored self-adhesive wallpaper.

#include <U8g2lib.h>
#include <SPI.h>

#define GAIN      100
#define STEP      8
#define LOW_SOUND 50
#define MAX_SOUND 600


U8G2_GP1287AI_256X50_1_4W_SW_SPI u8g2(U8G2_R0, /* clock=*/ 13, /* data=*/ 11, /* cs=*/ 10, /* dc=*/ 9, /* reset=*/ 8);

  int strela=-36;
  int hMeter = 64;
  int vMeter = 85;
  int rMeter = 77;
  int ur,urr,x;

  int strelax =-36;
  int hMeterx = 194;
  int vMeterx = 85;
  int rMeterx = 77;
  int urx,urrx,xx;

void setup(void) {
  u8g2.begin();
  u8g2.setContrast(25);
  u8g2.enableUTF8Print();
  u8g2.setFont(u8g2_font_4x6_tf);
  analogReference(INTERNAL);  // если очень маленький уровень сигнала
  pinMode(A2,INPUT);
  pinMode(A0,INPUT);
}

void loop (){

  strela = map(log(analogRead(A2))*GAIN, LOW_SOUND,MAX_SOUND, -36,36);
  strela = constrain(strela, -36, 36);
  urr = strela;if(urr<ur){ur=ur-STEP;}else{ur = strela;}


  strelax = map(log(analogRead(A0))*GAIN, LOW_SOUND,MAX_SOUND, -36,36);
  strelax = constrain(strelax, -36, 36);
  urrx = strelax;if(urrx<urx){urx=urx-STEP;}else{urx = strelax;}


  u8g2.firstPage();
  do {
  u8g2.drawFrame(0,0,256,50);
  u8g2.drawRFrame(130,2,124,46,3);
  u8g2.drawRFrame(2,2,127,46,3);
  u8g2.drawLine(20, 15, 70, 15);// line 1
  u8g2.drawLine(150, 15, 200, 15);
  u8g2.drawLine(73, 15, 108, 15);
  u8g2.drawLine(203, 15, 238, 15);
  u8g2.drawLine(73, 14, 108, 14);// line 2
  u8g2.drawLine(203, 14, 238, 14);
  u8g2.drawLine(15, 17, 70, 17);// line3
  u8g2.drawLine(145, 17, 200, 17);

  byte b1_2[10]{20,57,42,33,64,91,50,70,77,104};
  byte c1_2[10]{12,14,14,12,14,12,12,12,12,12};
  for(int i=0;i<10;i++){u8g2.drawLine(b1_2[i], 15, b1_2[i], c1_2[i]);}
  byte b3[5]{15,29,43,57,70};
  for(int i=0;i<5;i++){u8g2.drawLine(b3[i], 17, b3[i], 20);}


  byte b1x_2[10]{150,187,172,163,194,221,180,200,207,234};
  byte c1x_2[10]{12,14,14,12,14,12,12,12,12,12};
  for(int i=0;i<10;i++){u8g2.drawLine(b1x_2[i], 15, b1x_2[i], c1x_2[i]);}
  byte b3x[5]{145,159,173,187,200};
  for(int i=0;i<5;i++){u8g2.drawLine(b3x[i], 17, b3x[i], 20);}


  u8g2.setCursor(17, 10); u8g2.print(F("20 10   3    0 1"));
  u8g2.setCursor(147, 10); u8g2.print(F("20 10   3    0 1"));
  u8g2.setCursor(14, 28); u8g2.print(F("0  25"));
  u8g2.setCursor(144, 28); u8g2.print(F("0  25"));
  u8g2.setCursor(40, 28);  u8g2.print(F("50"));
  u8g2.setCursor(170, 28);  u8g2.print(F("50"));
  u8g2.setCursor(55, 28);u8g2.print(F("75"));
  u8g2.setCursor(185, 28);u8g2.print(F("75"));
  u8g2.setCursor(68, 28);u8g2.print(F("100"));
  u8g2.setCursor(198, 28);u8g2.print(F("100"));
  u8g2.setCursor(90, 10);u8g2.print(F("2"));
  u8g2.setCursor(220, 10);u8g2.print(F("2"));
  u8g2.setCursor(103, 10);u8g2.print(F("3"));
  u8g2.setCursor(233, 10);u8g2.print(F("3"));

  u8g2.setCursor(14, 40); u8g2.print(F("-"));
  u8g2.setCursor(104, 40);u8g2.print(F("+"));
  u8g2.setCursor(44, 40);u8g2.print(F("VU meter"));

  u8g2.setCursor(90, 40);u8g2.print(F("L"));
  u8g2.drawFrame(88,33,7,9);

  u8g2.setCursor(144, 40); u8g2.print(F("-"));
  u8g2.setCursor(234, 40);u8g2.print(F("+"));
  u8g2.setCursor(174, 40);u8g2.print(F("VU meter"));

  u8g2.setCursor(220, 40);u8g2.print(F("R"));
  u8g2.drawFrame(218,33,7,9);

  int a1 = (hMeter + (sin(ur / 57.296) * rMeter)); // meter needle horizontal coordinate
  int a2 = (vMeter - (cos(ur / 57.296) * rMeter)); // meter needle vertical coordinate
  u8g2.drawLine(a1, a2, hMeter, vMeter);
 // u8g2.drawLine(a1-1, a2-1, hMeter-1, vMeter+1);


  int a1x = (hMeterx + (sin(urx / 57.296) * rMeterx)); // meter needle horizontal coordinate
  int a2x = (vMeterx - (cos(urx / 57.296) * rMeterx)); // meter needle vertical coordinate
  u8g2.drawLine(a1x, a2x, hMeterx, vMeterx);
 // u8g2.drawLine(a1x-1, a2x-1, hMeterx-1, vMeterx+1);


  } while ( u8g2.nextPage() );

}

Retro look Analog style VU meter on VFD display with Arduino Nano


Raspberry Pi 5 7 Inch Touch Screen IPS 1024x600 HD LCD HDMI-compatible Display for RPI 4B 3B+ OPI 5 AIDA64 PC Secondary Screen(Without Speaker)
BUY NOW


- Comments(0)
- Likes(3)
More by Mirko Pavleski
-
 Arduino 3D Printed self Balancing Cube
Self-balancing devices are electronic devices that use sensors and motors to keep themselves balanc...
Arduino 3D Printed self Balancing Cube
Self-balancing devices are electronic devices that use sensors and motors to keep themselves balanc...
-
 DIY Tesla Coil based Plasma Rife Machine
In several of my previous videos, I presented you with different ways to make a Rife Machine, from ...
DIY Tesla Coil based Plasma Rife Machine
In several of my previous videos, I presented you with different ways to make a Rife Machine, from ...
-
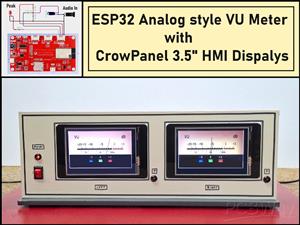 ESP32 Analog VU Meter – Smooth Needle, Real Audio Response (DIY Build)
In several of my previous videos I have shown you how to make analog VU meters emulated on differen...
ESP32 Analog VU Meter – Smooth Needle, Real Audio Response (DIY Build)
In several of my previous videos I have shown you how to make analog VU meters emulated on differen...
-
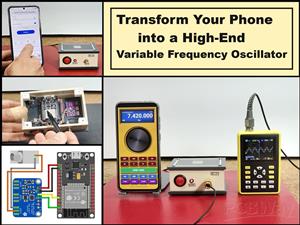 The Ultimate Smartphone VFO ESP32 & Si5351 Wireless Control
Variable frequency oscillators (VFOs) are commonly used in radio transmitters and receivers, especi...
The Ultimate Smartphone VFO ESP32 & Si5351 Wireless Control
Variable frequency oscillators (VFOs) are commonly used in radio transmitters and receivers, especi...
-
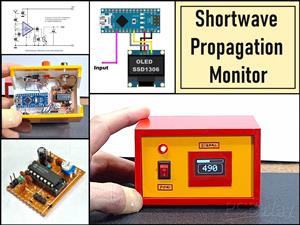 DIY Shortwave Propagation Monitor - Measure Ionosphere Conditions
Shortwave Propagation is the way radio waves in the 3 to 30 MHz range travel from point A to point ...
DIY Shortwave Propagation Monitor - Measure Ionosphere Conditions
Shortwave Propagation is the way radio waves in the 3 to 30 MHz range travel from point A to point ...
-
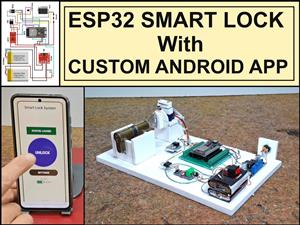 Professional grade Smart Lock with ESP32, BLE and Android App Control
An electronic codelock is a security device that grants access using a numerical sequence—a PIN cod...
Professional grade Smart Lock with ESP32, BLE and Android App Control
An electronic codelock is a security device that grants access using a numerical sequence—a PIN cod...
-
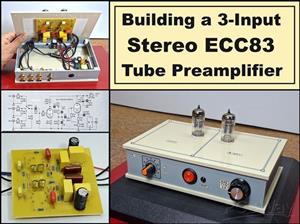 Building a 3-Input Stereo ECC83 (12AX7) Tube Preamp
Some time ago I presented you a project for a 3W stereo tube amplifier with a GU32 output vacuum t...
Building a 3-Input Stereo ECC83 (12AX7) Tube Preamp
Some time ago I presented you a project for a 3W stereo tube amplifier with a GU32 output vacuum t...
-
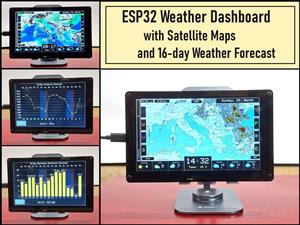 ESP32 Weather Dashboard with Satellite Maps and 16-day Weather Forecast
As you can see from my previous videos, besides Electronics, my fields of experimentation and proje...
ESP32 Weather Dashboard with Satellite Maps and 16-day Weather Forecast
As you can see from my previous videos, besides Electronics, my fields of experimentation and proje...
-
 Retro Analog VU Meter on Round dispalys (ESP32 and GC9A01)
Recently, in one of my previous videos I presented you a Retro VU Meter project on round displays ...
Retro Analog VU Meter on Round dispalys (ESP32 and GC9A01)
Recently, in one of my previous videos I presented you a Retro VU Meter project on round displays ...
-
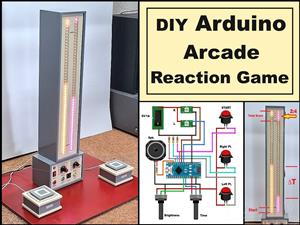 Ultimate 2-Player Reaction Timer with WS2812B LED Strips & Arduino
Arcade reaction game is a genre of play designed to test a player's physical response time and hand...
Ultimate 2-Player Reaction Timer with WS2812B LED Strips & Arduino
Arcade reaction game is a genre of play designed to test a player's physical response time and hand...
-
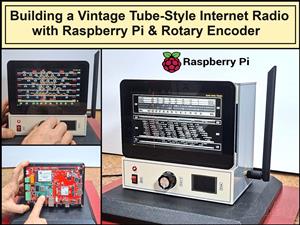 Building a Vintage Tube-Style Internet Radio with Raspberry Pi & Rotary Encoder
Internet radio (also known as web radio or net radio) is a digital audio service transmitted via th...
Building a Vintage Tube-Style Internet Radio with Raspberry Pi & Rotary Encoder
Internet radio (also known as web radio or net radio) is a digital audio service transmitted via th...
-
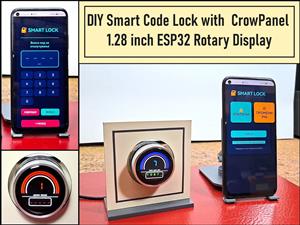 DIY Smart Code Lock with CrowPanel 1.28 ESP32 Rotary Display
A code lock is a keyless security device—either mechanical or electronic—that restricts access to d...
DIY Smart Code Lock with CrowPanel 1.28 ESP32 Rotary Display
A code lock is a keyless security device—either mechanical or electronic—that restricts access to d...
-
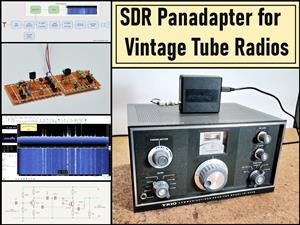 SDR Panadapter for Vintage Tube Radios – Step-by-Step Tutorial
A radio panadapter (or panoramic adapter) is a device or software tool used in amateur radio and ot...
SDR Panadapter for Vintage Tube Radios – Step-by-Step Tutorial
A radio panadapter (or panoramic adapter) is a device or software tool used in amateur radio and ot...
-
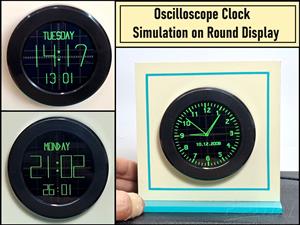 Oscilloscope Clock Simulation on a Round ESP32 Display
An oscilloscope clock is a circuit that turns an old analog oscilloscope into a stylish, retro-them...
Oscilloscope Clock Simulation on a Round ESP32 Display
An oscilloscope clock is a circuit that turns an old analog oscilloscope into a stylish, retro-them...
-
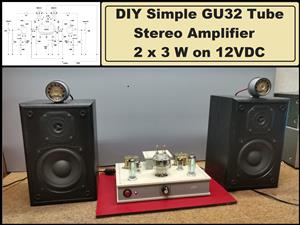 DIY Simple GU32 Tube Stereo Amplifier (2x3W on 12VDC)
Vacuum tube amplifiers are often favored for their smooth harmonic distortion, especially in the low...
DIY Simple GU32 Tube Stereo Amplifier (2x3W on 12VDC)
Vacuum tube amplifiers are often favored for their smooth harmonic distortion, especially in the low...
-
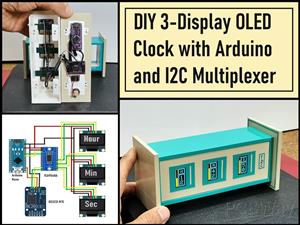 DIY 3-Display OLED Clock with Arduino and I2C Multiplexer
In this video I want to present you another unusual clock to add to my large collection of such DIY...
DIY 3-Display OLED Clock with Arduino and I2C Multiplexer
In this video I want to present you another unusual clock to add to my large collection of such DIY...
-
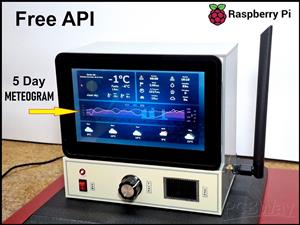 Build a 5-Day forecast Raspberry Pi Weather Dashboard (Step-by-Step)
Recently in one of my previous videos,I introduced you to the 7 inch Elecrow Pi Terminal and how to...
Build a 5-Day forecast Raspberry Pi Weather Dashboard (Step-by-Step)
Recently in one of my previous videos,I introduced you to the 7 inch Elecrow Pi Terminal and how to...
-
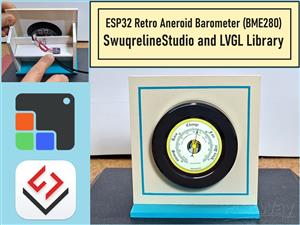 ESP32 Aneroid Barometer using Squareline Studio and LVGL on CrowPanel Round display
A barometer is a scientific instrument used to measure atmospheric pressure. Rising Pressure genera...
ESP32 Aneroid Barometer using Squareline Studio and LVGL on CrowPanel Round display
A barometer is a scientific instrument used to measure atmospheric pressure. Rising Pressure genera...
-
-
ARPS-2 – Arduino-Compatible Robot Project Shield for Arduino UNO
2339 0 5 -
A Compact Charging Breakout Board For Waveshare ESP32-C3
2821 3 7 -
AI-driven LoRa & LLM-enabled Kiosk & Food Delivery System
3026 2 0 -
-
-
-
ESP32-C3 BLE Keyboard - Battery Powered with USB-C Charging
3064 0 2 -