


|
|
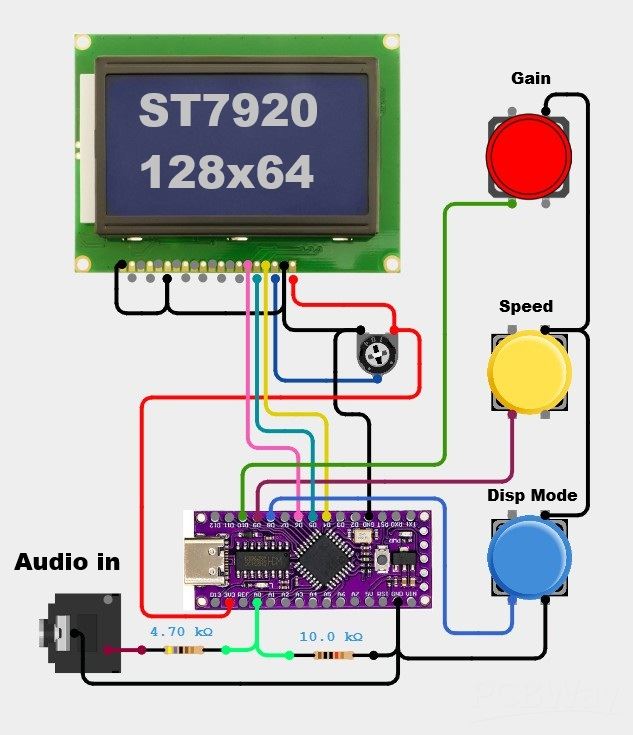
LGT8F328P MCU Board |
x 1 | |
|
|
128x64 LCD Display (ST7920 chip) |
x 1 | |
|
|
Resistor 10k ohm |
x 1 | |
|
|
Resistor 4.75k ohm |
x 1 | |
|
|
Trimmer Potentiometer, 10 kohm |
x 1 | |
|
|
Pushbutton |
x 1 |

|
Soldering Iron Kit |
|

|
arduino IDEArduino
|
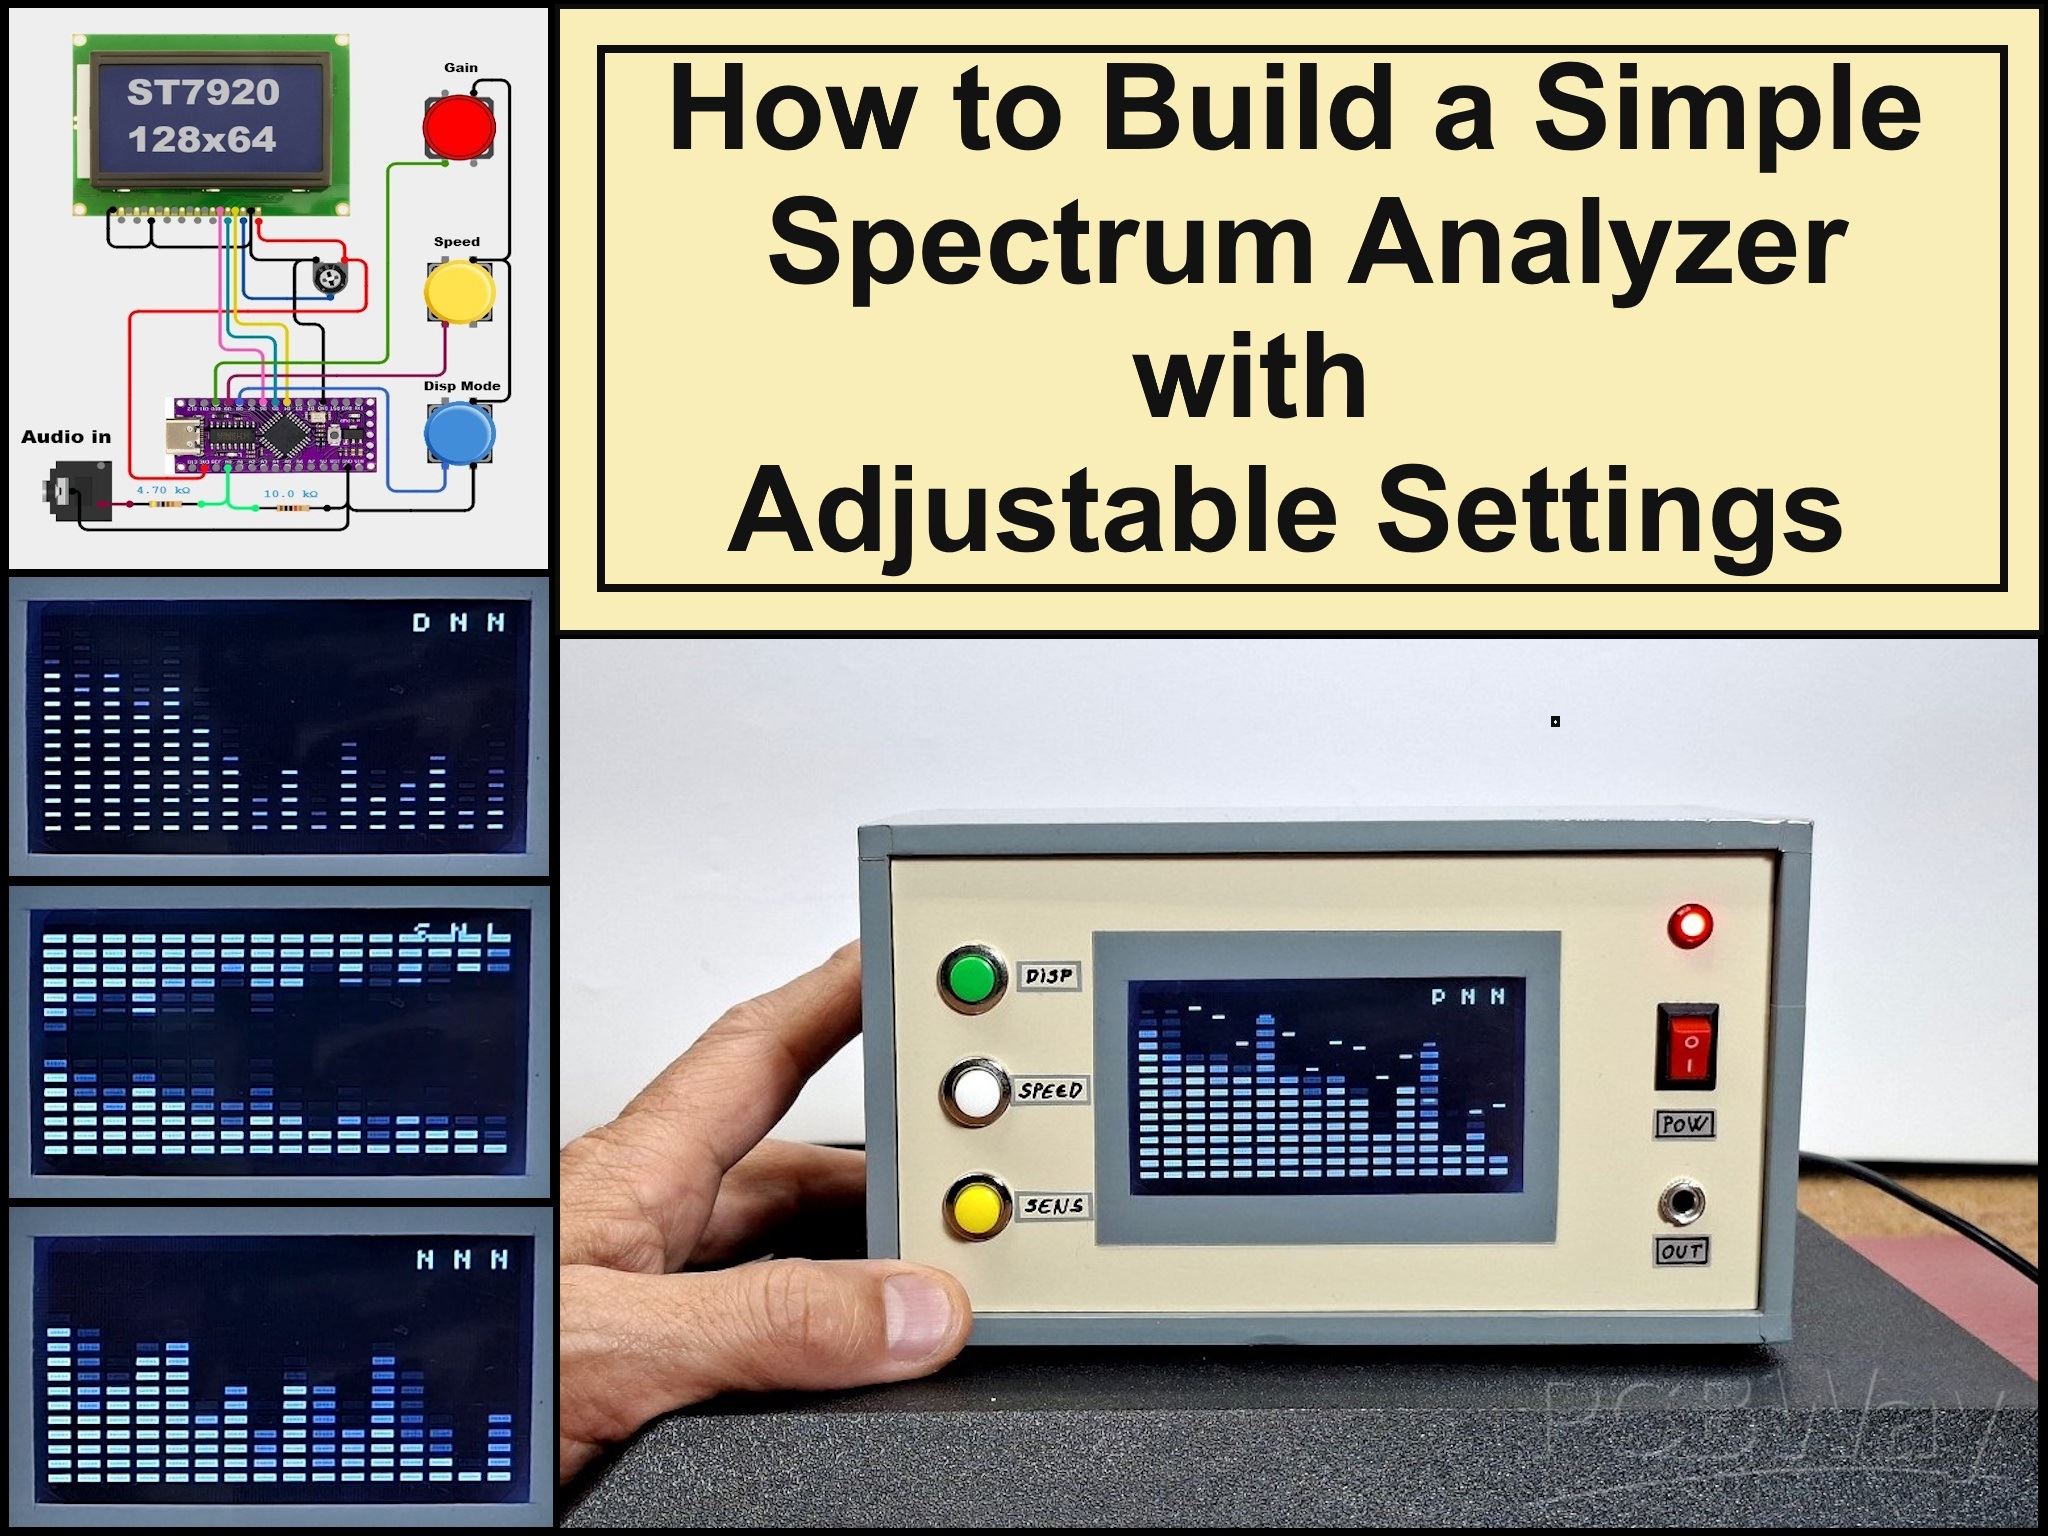
How to Build a Simple Audio Spectrum Analyzer with Adjustable Settings
An audio spectrum analyzer is an electronic device or software tool that measures and visually displays the frequency spectrum of an audio signal. It shows the different frequencies present in the signal and their respective amplitudes, typically on a graph with frequency on the horizontal axis and amplitude on the vertical axis. In today's video, I will present you with a very simple way to create an audio spectrum analyzer that, despite its simplicity, has many possibilities for adjusting various parameters directly via buttons, without making any changes to the code.
I got the initial idea from a project on the rcl-radio website and decided to expand the original project with more features. The device uses LGT8F328P which is compatible with Arduino Nano 3 and is significantly cheaper but also with better performance.
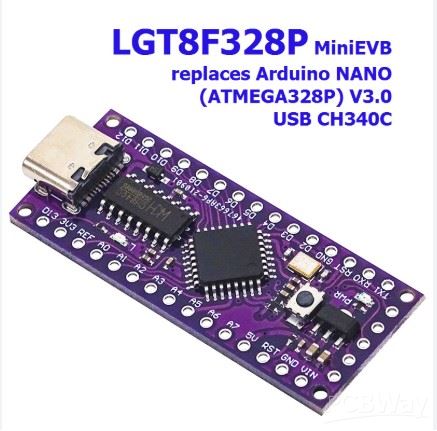
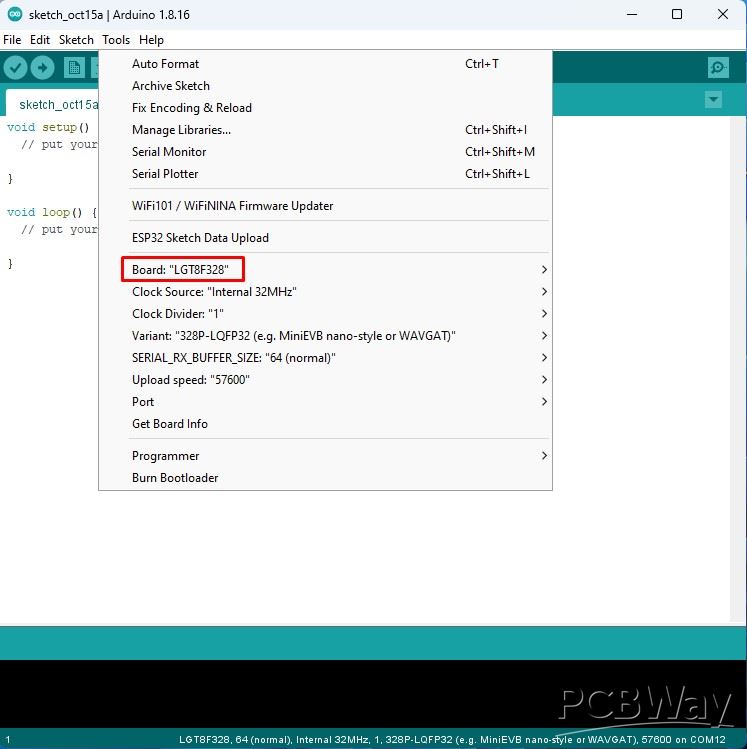
For support in Arduino IDE for LGT8F328P, we need to enter the given link (https://raw.githubusercontent.com/dbuezas/lgt8fx/master/package_lgt8fx_index.json) in File - Preferences - Additional Boards Manager, and then in Tools - Boards Manager we install this microcontroller.
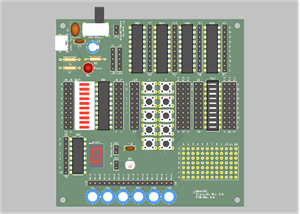
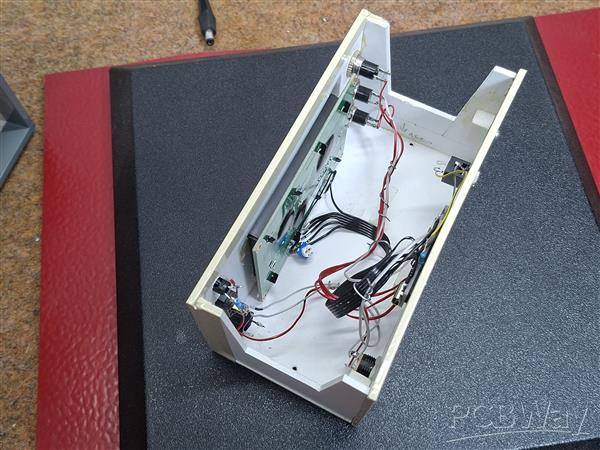
As I mentioned earlier, the device is extremely simple to build and consists of only a few components
- LGT8F328P MCU board
- ST7920 chip LCD display with a resolution of 128X64
- and two resistors

This project is sponsored by PCBWay (https://www.pcbway.com/activity/8th-project-design-contest.html). From September 1st 2025 to 31st Januarry 2026 PCBWay organize the 8th Priject Design Contest. All interested participants can compete in three categories: Electronic Project, Mechanical Project or AIoT Project. The best projects will receive valuable prizes in cash, value cupons and developement boards. Don't miss this unique opportunity and submit your project as soon as possible. PCBWay has all the services you need to create the project at the Best price.
As for the code, it is designed in a way that allows you to easily change many more parameters. For example, The experimental Auto Gain option is very intuitive and works flawlessly, optimally adjusting the bar movements regardless of the input signal strength.
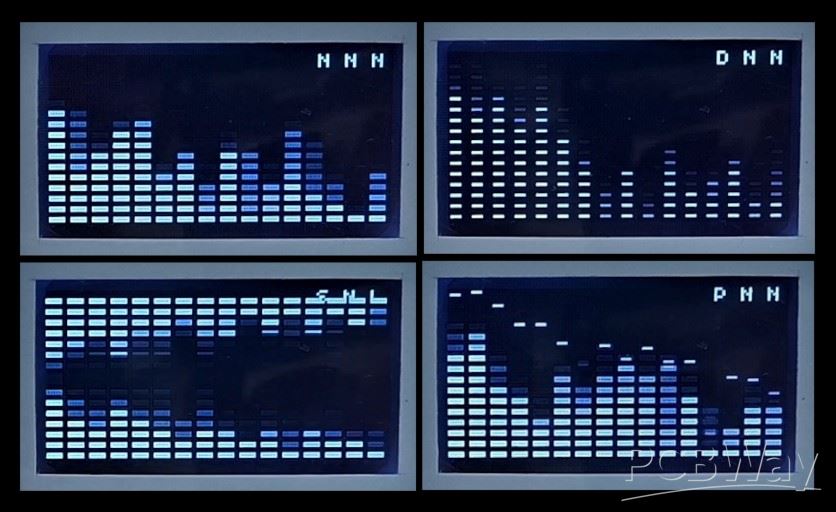
Now let me explain the functions of this spectrum analyzer. When turning on the device, three letters can be seen on the top right of the screen. They sequentially display the current MODE of each button, and are changed by pressing the corresponding button.
- Button 1 cycles through 4 display modes:
Normal: Standard bars
Peak Hold: Bars with peak indicators
Falling Dots: Dot visualization
Mirror: Symmetrical display
- Button 2 cycles through 3 speed modes:
Normal: Standard falling speed
Fast: Quick response
Slow: Slow falling with random elements
- and Button 3 cycles through 3 sensitivity modes:
Normal: Default gain
High: More sensitive (lower gain)
Low: Less sensitive (higher gain)
And finally a short conclusion. This project showcases a simple yet versatile audio spectrum analyzer built with the LGT8F328P microcontroller, offering multiple adjustable display, speed, and sensitivity modes for a customizable audio visualization experience.
#define AUTO_GAIN 0       // Auto volume adjustment (disabled for manual control)
#define VOL_THR 25        // Silence threshold (no display on matrix below this)
#define LOW_PASS 20       // Lower sensitivity threshold for noise (no jumps when no sound)
#define DEF_GAIN 80       // Default maximum threshold (ignored when GAIN_CONTROL is active)
#define FHT_N 256         // Spectrum width x2
#define LOG_OUT 1
#define PEAK_HOLD_TIME 2000     // Peak hold time in ms

// Button pins
#define BUTTON1 8
#define BUTTON2 9
#define BUTTON3 10

// Manually defined array of tones, first smooth, then steeper
byte posOffset[16] = {1, 2, 3, 4, 5, 6, 7, 8, 9, 10, 11, 12, 13, 14, 15, 16}; // 1500 Hz
//byte posOffset[16] = {1, 2, 3, 4, 6, 8, 10, 13, 16, 20, 25, 30, 35, 40, 45, 50}; // 4000 Hz

#define cbi(sfr, bit) (_SFR_BYTE(sfr) &= ~_BV(bit))
#define sbi(sfr, bit) (_SFR_BYTE(sfr) |= _BV(bit))

#include <Wire.h>
#include <U8glib.h>  // http://rcl-radio.ru/wp-content/uploads/2023/04/U8glib.zip
#include <FHT.h>     // http://forum.rcl-radio.ru/misc.php?action=pan_download&item=297&download=1

#define EN 6
#define RW 5
#define CS 4

//U8GLIB_SH1106_128X64 lcd(U8G_I2C_OPT_DEV_0|U8G_I2C_OPT_FAST);  // Dev 0, Fast I2C / TWI
U8GLIB_ST7920_128X64_1X lcd(EN, RW, CS); // serial use, PSB = GND

byte gain = DEF_GAIN;
unsigned long gainTimer, times;
byte maxValue, maxValue_f;
float k = 0.1;
byte ur[16], urr[16];

// Button state variables
bool button1State = false;
bool button2State = false;
bool button3State = false;
unsigned long button1Time = 0;
unsigned long button2Time = 0;
unsigned long button3Time = 0;

// Mode variables
byte displayMode = 0;           // 0=normal, 1=peak hold, 2=falling dots, 3=symmetrical
byte speedMode = 0;             // 0=normal, 1=fast, 2=slow
byte sensitivityMode = 0;       // 0=normal, 1=high, 2=low
byte peakHold[16];              // Peak hold values for each band
unsigned long peakTimer[16];    // Timer for peak decay

void setup() {
  delay(100);
  sbi(ADCSRA, ADPS2);
  cbi(ADCSRA, ADPS1);
  sbi(ADCSRA, ADPS0);
  Serial.begin(9600);
  Wire.begin();
  Wire.setClock(800000L);
  lcd.begin();
  // lcd.setRot180();
  lcd.setFont(u8g_font_profont11r);
  analogReadResolution(10); // ADC 10 BIT
  analogReference(INTERNAL1V024);
  pinMode(A0, INPUT); // INPUT AUDIO

  // Initialize button pins
  pinMode(BUTTON1, INPUT_PULLUP);
  pinMode(BUTTON2, INPUT_PULLUP);
  pinMode(BUTTON3, INPUT_PULLUP);

  // Initialize peak hold array
  for(int i = 0; i < 16; i++) {
    peakHold[i] = 0;
    peakTimer[i] = 0;
  }
}

void handleButtons() {
  // Button 1 - Display Mode Cycle
  if (digitalRead(BUTTON1) == LOW) {
    if (millis() - button1Time > 300) { // Debounce
      displayMode = (displayMode + 1) % 4; // Cycle through 4 modes
      button1Time = millis();
    }
  }

  // Button 2 - Speed Mode Cycle
  if (digitalRead(BUTTON2) == LOW) {
    if (millis() - button2Time > 300) {
      speedMode = (speedMode + 1) % 3; // Cycle through 3 speed modes
      button2Time = millis();
    }
  }

  // Button 3 - Sensitivity Cycle
  if (digitalRead(BUTTON3) == LOW) {
    if (millis() - button3Time > 300) {
      sensitivityMode = (sensitivityMode + 1) % 3; // Cycle through 3 sensitivity modes
      button3Time = millis();

      // Adjust gain based on sensitivity
      switch(sensitivityMode) {
        case 0: gain = DEF_GAIN; break;    // Normal
        case 1: gain = DEF_GAIN / 2; break; // High sensitivity
        case 2: gain = DEF_GAIN * 2; break; // Low sensitivity
      }
    }
  }
}

void updatePeakHold() {
  for (int i = 0; i < 16; i++) {
    int posLevel = map(fht_log_out[posOffset[i]], LOW_PASS, gain, 0, 60);
    posLevel = constrain(posLevel, 0, 60);

    if (posLevel > peakHold[i]) {
      peakHold[i] = posLevel;
      peakTimer[i] = millis();
    } else if (millis() - peakTimer[i] > PEAK_HOLD_TIME) {
      if (peakHold[i] > 0) peakHold[i]--;
    }
  }
}

void drawModeIndicators() {
  // Display mode indicators at top right
  lcd.setFont(u8g_font_04b_03);

  // Display mode indicator (N, P, D, S)
  char modeChar = 'N';
  switch(displayMode) {
    case 0: modeChar = 'N'; break; // Normal
    case 1: modeChar = 'P'; break; // Peak
    case 2: modeChar = 'D'; break; // Dot
    case 3: modeChar = 'S'; break; // Symmetrical
  }

  // Speed mode indicator (N, F, S)
  char speedChar = 'N';
  switch(speedMode) {
    case 0: speedChar = 'N'; break; // Normal
    case 1: speedChar = 'F'; break; // Fast
    case 2: speedChar = 'S'; break; // Slow
  }

  // Sensitivity indicator (N, H, L)
  char sensChar = 'N';
  switch(sensitivityMode) {
    case 0: sensChar = 'N'; break; // Normal
    case 1: sensChar = 'H'; break; // High
    case 2: sensChar = 'L'; break; // Low
  }

  // Draw all three indicators at top right
  lcd.drawStr(100, 5, String(modeChar).c_str());
  lcd.drawStr(110, 5, String(speedChar).c_str());
  lcd.drawStr(120, 5, String(sensChar).c_str());
}

void drawSpectrum() {
  lcd.firstPage();
  do {
    for (int pos = 0; pos < 128; pos += 8) {
      int band = pos / 8;
      int posLevel = map(fht_log_out[posOffset[band]], LOW_PASS, gain, 0, 60);
      posLevel = constrain(posLevel, 0, 60);

      if(millis() - times < 2000) {
        posLevel = 60; // Startup animation
      }

      urr[band] = posLevel;

      // Apply speed mode to falling effect
      int fallSpeed = 1;
      switch(speedMode) {
        case 0: fallSpeed = 1; break; // Normal
        case 1: fallSpeed = 3; break; // Fast fall
        case 2: fallSpeed = 1; if(random(2) == 0) fallSpeed = 0; break; // Slow/random
      }

      if(urr[band] < ur[band]) {
        ur[band] = max(ur[band] - fallSpeed, 0);
      } else {
        ur[band] = posLevel;
      }

      delayMicroseconds(200);

      // Draw based on display mode
      switch(displayMode) {
        case 0: // Normal bars
          for (int v_pos = 0; v_pos < ur[band] + 4; v_pos += 4) {
            lcd.drawBox(pos, 61 - v_pos, 6, 2);
          }
          break;

        case 1: // Peak hold with bars
          for (int v_pos = 0; v_pos < ur[band] + 4; v_pos += 4) {
            lcd.drawBox(pos, 61 - v_pos, 6, 2);
          }
          // Draw peak dots
          if(peakHold[band] > 0) {
            lcd.drawBox(pos + 1, 61 - peakHold[band], 4, 1);
          }
          break;

        case 2: // Falling dots
          for (int v_pos = 0; v_pos < ur[band]; v_pos += 4) {
            lcd.drawBox(pos + 1, 61 - v_pos, 4, 1);
          }
          break;

        case 3: // Symmetrical mode
          for (int v_pos = 0; v_pos < ur[band] + 4; v_pos += 4) {
            lcd.drawBox(pos, 61 - v_pos, 6, 2);
            lcd.drawBox(pos, 3 + v_pos, 6, 2); // Mirror at top
          }
          break;
      }
    }

    // Draw mode indicators at top right
    drawModeIndicators();

  } while(lcd.nextPage());
}

void loop() {
  analyzeAudio();
  handleButtons();
  updatePeakHold();
  drawSpectrum();

  if (AUTO_GAIN) {
    maxValue_f = maxValue * k + maxValue_f * (1 - k);
    if (millis() - gainTimer > 1500) {
      if (maxValue_f > VOL_THR) gain = maxValue_f;
      else gain = 100;
      gainTimer = millis();
    }
  }
}

void analyzeAudio() {
  for (int i = 0 ; i < FHT_N ; i++) {
    int sample = analogRead(A0);
    fht_input[i] = sample; // put real data into bins
  }
  fht_window();  // window the data for better frequency response
  fht_reorder(); // reorder the data before doing the fht
  fht_run();     // process the data in the fht
  fht_mag_log(); // take the output of the fht
}

How to Build a Simple Audio Spectrum Analyzer with Adjustable Settings


Raspberry Pi 5 7 Inch Touch Screen IPS 1024x600 HD LCD HDMI-compatible Display for RPI 4B 3B+ OPI 5 AIDA64 PC Secondary Screen(Without Speaker)
BUY NOW


- Comments(1)
- Likes(1)
More by Mirko Pavleski
-
 Arduino 3D Printed self Balancing Cube
Self-balancing devices are electronic devices that use sensors and motors to keep themselves balanc...
Arduino 3D Printed self Balancing Cube
Self-balancing devices are electronic devices that use sensors and motors to keep themselves balanc...
-
 Elecrow All-in-One Arduino Starter Kit Review - 20 Projects & 16 Modules
This time I will describe a simple and practical way to enter the world of microcontrollers, specif...
Elecrow All-in-One Arduino Starter Kit Review - 20 Projects & 16 Modules
This time I will describe a simple and practical way to enter the world of microcontrollers, specif...
-
 ESP32-C3 Color Detector with TCS34725, Real-Time RGB Detection & Web Interface
Color detection is a fundamental task in many embedded systems – from industrial sorting machines t...
ESP32-C3 Color Detector with TCS34725, Real-Time RGB Detection & Web Interface
Color detection is a fundamental task in many embedded systems – from industrial sorting machines t...
-
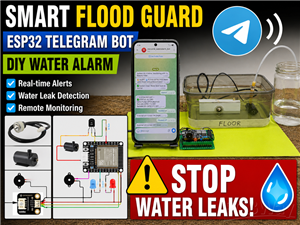 DIY ESP32 Telegram Flood Protection System - Smart Home Automation
Recently I had an unpleasant experience in my home, specifically my ground floor was flooded as a r...
DIY ESP32 Telegram Flood Protection System - Smart Home Automation
Recently I had an unpleasant experience in my home, specifically my ground floor was flooded as a r...
-
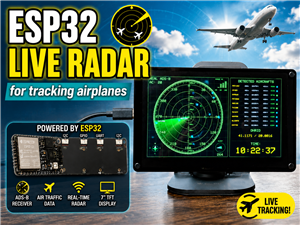 Real-Time Air Traffic Radar using ESP32 + ADS-B Data
ADS-B, which stands for Automatic Dependent Surveillance-Broadcast, is the modern standard for trac...
Real-Time Air Traffic Radar using ESP32 + ADS-B Data
ADS-B, which stands for Automatic Dependent Surveillance-Broadcast, is the modern standard for trac...
-
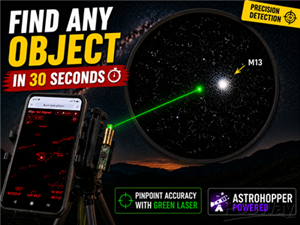 DIY Green Laser Night Sky Object Finder - Find Stars & Galaxies Instantly with great accuracy
As an amateur astronomer, especially at the beginning, the most difficult part of observing the nig...
DIY Green Laser Night Sky Object Finder - Find Stars & Galaxies Instantly with great accuracy
As an amateur astronomer, especially at the beginning, the most difficult part of observing the nig...
-
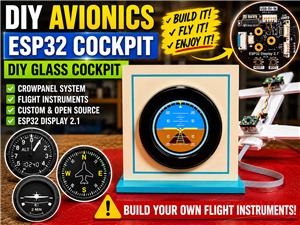 DIY Avionics Simulator with ESP32 - Artificial Horizon, Compass & Altimeter
The inspiration for this project comes from classical aircraft cockpit instruments used for navigat...
DIY Avionics Simulator with ESP32 - Artificial Horizon, Compass & Altimeter
The inspiration for this project comes from classical aircraft cockpit instruments used for navigat...
-
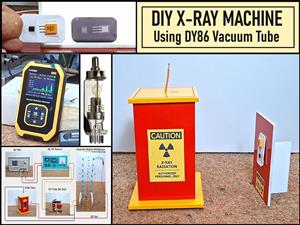 DIY Miniature X-Ray Machine using a TV Vacuum Tube DY86
An X-ray machine (or radiograph) is a quick, painless medical test that produces images of the struc...
DIY Miniature X-Ray Machine using a TV Vacuum Tube DY86
An X-ray machine (or radiograph) is a quick, painless medical test that produces images of the struc...
-
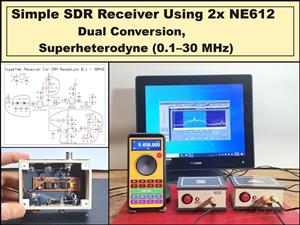 Simple SDR Receiver Using 2x NE612 - Dual Conversion, Superheterodyne (0.1–30 MHz)
SDR (Software Defined Radio) is a radio system in which most of the functions of a classic radio (f...
Simple SDR Receiver Using 2x NE612 - Dual Conversion, Superheterodyne (0.1–30 MHz)
SDR (Software Defined Radio) is a radio system in which most of the functions of a classic radio (f...
-
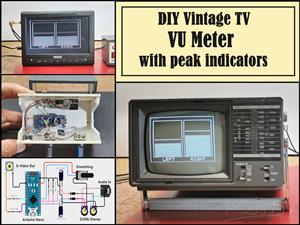 DIY Vintage TV VU Meter with peak indicators
Some time ago in one of my projects I presented you a way to turn a black and white old mini TV int...
DIY Vintage TV VU Meter with peak indicators
Some time ago in one of my projects I presented you a way to turn a black and white old mini TV int...
-
 DIY Tesla Coil based Plasma Rife Machine
In several of my previous videos, I presented you with different ways to make a Rife Machine, from ...
DIY Tesla Coil based Plasma Rife Machine
In several of my previous videos, I presented you with different ways to make a Rife Machine, from ...
-
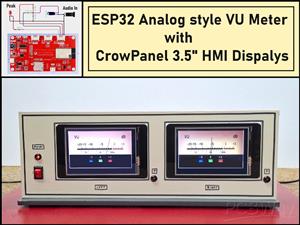 ESP32 Analog VU Meter – Smooth Needle, Real Audio Response (DIY Build)
In several of my previous videos I have shown you how to make analog VU meters emulated on differen...
ESP32 Analog VU Meter – Smooth Needle, Real Audio Response (DIY Build)
In several of my previous videos I have shown you how to make analog VU meters emulated on differen...
-
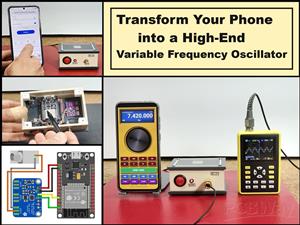 The Ultimate Smartphone VFO ESP32 & Si5351 Wireless Control
Variable frequency oscillators (VFOs) are commonly used in radio transmitters and receivers, especi...
The Ultimate Smartphone VFO ESP32 & Si5351 Wireless Control
Variable frequency oscillators (VFOs) are commonly used in radio transmitters and receivers, especi...
-
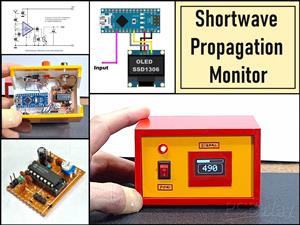 DIY Shortwave Propagation Monitor - Measure Ionosphere Conditions
Shortwave Propagation is the way radio waves in the 3 to 30 MHz range travel from point A to point ...
DIY Shortwave Propagation Monitor - Measure Ionosphere Conditions
Shortwave Propagation is the way radio waves in the 3 to 30 MHz range travel from point A to point ...
-
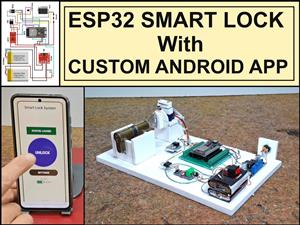 Professional grade Smart Lock with ESP32, BLE and Android App Control
An electronic codelock is a security device that grants access using a numerical sequence—a PIN cod...
Professional grade Smart Lock with ESP32, BLE and Android App Control
An electronic codelock is a security device that grants access using a numerical sequence—a PIN cod...
-
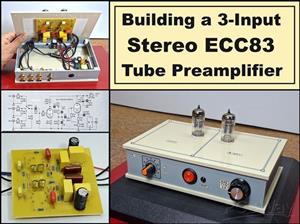 Building a 3-Input Stereo ECC83 (12AX7) Tube Preamp
Some time ago I presented you a project for a 3W stereo tube amplifier with a GU32 output vacuum t...
Building a 3-Input Stereo ECC83 (12AX7) Tube Preamp
Some time ago I presented you a project for a 3W stereo tube amplifier with a GU32 output vacuum t...
-
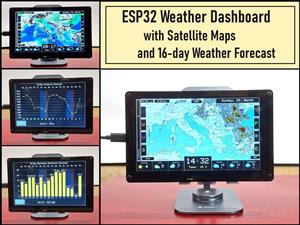 ESP32 Weather Dashboard with Satellite Maps and 16-day Weather Forecast
As you can see from my previous videos, besides Electronics, my fields of experimentation and proje...
ESP32 Weather Dashboard with Satellite Maps and 16-day Weather Forecast
As you can see from my previous videos, besides Electronics, my fields of experimentation and proje...
-
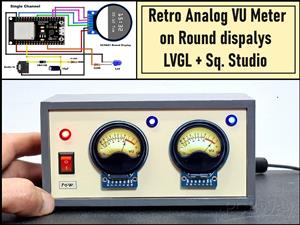 Retro Analog VU Meter on Round dispalys (ESP32 and GC9A01)
Recently, in one of my previous videos I presented you a Retro VU Meter project on round displays ...
Retro Analog VU Meter on Round dispalys (ESP32 and GC9A01)
Recently, in one of my previous videos I presented you a Retro VU Meter project on round displays ...
-
Programmable Mist Maker - XIAO / QT PY Extension
1054 2 1 -
RadioHAT - Raspberry Pi radio development platform
850 0 2 -
-
-
-
-
ARPS-2 – Arduino-Compatible Robot Project Shield for Arduino UNO
3316 0 6 -
A Compact Charging Breakout Board For Waveshare ESP32-C3
3921 3 8 -
AI-driven LoRa & LLM-enabled Kiosk & Food Delivery System
4309 2 2