


|
|
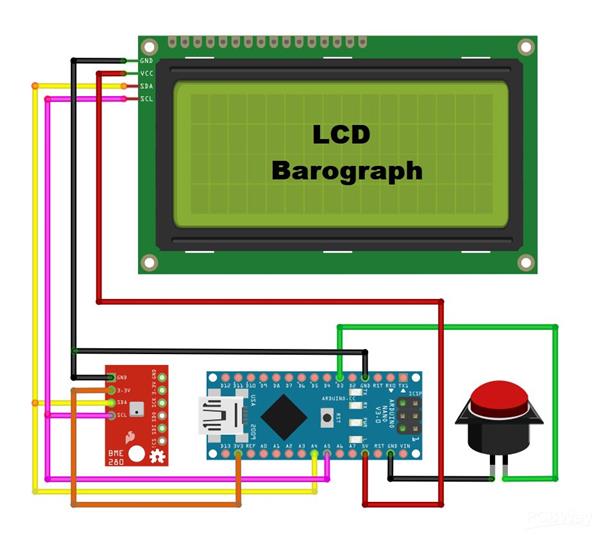
Arduino_Nano_v3.x |
x 1 | |
|
|
16x4 LCD Display |
x 1 | |
|
|
button |
x 1 | |
|
|
BME280 sensor board |
x 1 |

|
Soldering iron |
|

|
Soldering Iron Wire Welding Lead Roll |
Arduino Barometer + Barograph with BME280 Sensor
A barograph is a barometer that records the barometric pressure over time in graphical form. This instrument is also used to make a continuous recording of atmospheric pressure.
The former Barographs use the pressure-sensitive element, which is linked to a pen arm in such a way that the vertical displacement of the pen is proportional to the changes in the atmospheric pressure. This pen marks pressure changes on specially marked paper that is placed on a disc that rotates 360 degrees over 24 hours. In the picture below you can see what a Barograph from the last century looks like.

The barometer and the barograph are basic local instruments (independent of the Internet) in Meteorology that serve to predict the weather. This time I will present you a very simple way, using an Arduino microcontroller, you can make an electronic Barometer + Barograph that presents the results in graphic form on a 20x4 LCD display. The basic project is taken from "cxem.net" by the author AMatroskin, in which I modified and now the pressure is displayed in hPa instead of mmHg, and what is much more important, instead of the Absolute, the Relative Atmospheric Pressure for the specific altitude is displayed, which is a common standard in Meteorology.
For this purpose we need to enter the Relative Standard Atmospheric Pressure for the current altitude (As described further in the text), in the line:
#define SEALEVELPRESSURE_HPA (932.17) // for Ohrid, 698m altitude
and we can calculate that, on one of the online calculators, such as:
https://www.mide.com/air-pressure-at-altitude-calculator
Also further down the line
value = round ((bme.seaLevelForAltitude(698, bme.readPressure())/100))
the current altitude in meters should be entered.

As I mentioned before, the device is very simple to build and contains only a few components:
- Arduino Nano microcontroller
- 20x4 I2C protocol LCD Display
- BME 280 Pressure sensor board
- and one Button
Now let's see how the device works in reality. First of all, it takes 24 hours to draw a complete graph. The display shows the current Relative Atmospheric Pressure, as well as the positive or negative difference in hectopascals, for a given previous time period. This period can be 3,6,12, and 24 hours. Correct interpretation of this difference is the basis for accurate weather prediction. And now a few words about the graph. The maximum number of values on the vertical axis can be 28 (7vertical dots on every of four rows). At the beginning of the code, the range in which the air pressure is read can be changed, i.e. the smallest and the largest value. Depending on these values, the resolution of the graph also changes. For example, if we choose the difference between the minimum and maximum pressure to be 28, then 1 Hectopascal corresponds to one line on the Y axis of the graph. The sixteen values on the X axis represent time, and here the resolution depends on the selected elapsed time value.
Basically, when the pressure rises, an improvement in the weather is expected, and conversely, when it decreases, a worsening of the weather is expected.

And finally, the device is placed in a suitable box made of PVC material with a thickness of 5 mm, and covered with self-adhesive colored wallpaper. Let me mention that the BME280 sensor is placed inside the box, because in this case we measure only the pressure, which is independent of the temperature .
/*
Barometer with digital and graphic display of atmospheric pressure data.
Components: Screen text LCD 2004, platform: arduinio nano/uno (Atmega328 or more), pressure sensor: BME 280.
Amatroskin 2022.
*/

#include <LiquidCrystal_I2C.h>
#include <Wire.h>
#include "GyverButton.h"
#include <Adafruit_Sensor.h>
#include <Adafruit_BME280.h>

#define SEALEVELPRESSURE_HPA (933,17)       // Set the height
#define BTN_PIN 3                            //Button Pin
#define BASE_PERIOD 675000                   //Main array acquisition period 675000ms = 11.25 min (*16 bars = 3 hours) maximum graph resolution
#define MIN_VAL 990                          //The minimum value displayed on the chart
#define MAX_VAL 1035                          //The maximum value displayed on the graph
LiquidCrystal_I2C lcd(0x27, 20, 4);          //We create the necessary objects
GButton butt1(BTN_PIN);
Adafruit_BME280 bme;

uint32_t tmr1, tmr2;                          //timer variables
uint32_t  set_period = BASE_PERIOD;           //Display period, changes in multiples of 3 hours (3, 6, 12, 24)
int16_t plot_array[20];                       //Data array for drawing a chart
uint16_t base_array [128];                    //The base array stores all measurements for the last 24 hours (128 cells * 11.25 minutes = 1440 minutes = 24 hours)
int16_t value, delta;                         //Current (taken) readings, difference in readings for a selected period of time
byte interval = 1;                            //Interval displayed on the screen (time difference between adjacent chart bars)
                                              // 11.25 min * 16 = 3 hours, 22.5 min - 6 hours, 45 min - 12 hours, 90 min - 24 hours
void setup() {
  read_all ();
  //  Serial.begin(9600);
  attachInterrupt(1, isr, CHANGE);
  butt1.setDebounce(80);                      // anti-bounce setting (default 80 ms)
  butt1.setTimeout(300);                      // hold timeout setting (default 500ms)
  lcd.init();
  lcd.backlight();
  lcd.clear();
  if (!bme.begin(0x76)) {                              //Initialization of the BME280 sensor at address 0x76 (default)
    //Serial.println("Could not find a valid BME280!");//Printing an Error Message to the Port Monitor
    lcd.setCursor(3, 1);
    lcd.print(F("No connection"));                     //___________________________or on the screen
    lcd.setCursor(5, 2);
    lcd.print(F("to sensor"));
    while (1);                                          //won't go without a sensor.
  }

  if (!digitalRead(BTN_PIN)) {                          //Reset settings when turned on with the button held down
    for (byte i = 0; i < 128; i++) base_array [i] = 0;  //Erase data
    update_all ();                                      //Save
    lcd.setCursor(5, 1);                                //Report it
    lcd.print(F("Reset data"));
    lcd.setCursor(9, 2);
    lcd.print(F("OK"));
  }
  while (!digitalRead(BTN_PIN));
  lcd.clear();

  initPlot();                                           //Initializing Symbols for Rendering

  value = round ((bme.seaLevelForAltitude(700, bme.readPressure())/100));//We take the current readings, convert to mm Hg.
  base_array[0] = value;
  get_data ();
}

void isr() {                                              //We poll the button in the interrupt to catch the click anyway
   butt1.tick();
}

void loop() {
  butt1.tick();                                           //Poll button
  if (butt1.isClick()) {                                  //When you press:
    interval *= 2;                                        //Switching the chart scale
    if (interval > 8) interval = 1;
    set_period = BASE_PERIOD * interval;                  //Recalculate the interval for updating data from the sensor
    get_data ();                                          //Update information on the display
  }

  if (millis() - tmr1 >= BASE_PERIOD) {                   //We collect the basic array of data
    tmr1 = millis();                                      //Every 11.25 minutes we take readings from the sensor
    for (int i = 126; i >= 0; i--) {                      //Shift the entire array by one point
      base_array[i + 1] = base_array[i];
    }
    value = round ((bme.seaLevelForAltitude(700, bme.readPressure())/100));//Convert to mm/Hg.
    base_array[0] = value;                                 //Write the latest readings to an array
    update_all ();                                         //And remember in EEPROM
  }

  if (millis() - tmr2 >= set_period) {                     //After a period of time set_period (milliseconds)
    tmr2 = millis();                                       //Refreshing the data on the screen
    get_data ();
  }
}

void get_data () {                                          //We draw 16 columns of the diagram on the screen
  for (int i = 15; i >= 0; i--) {
    drawPlot(0, 3, 16, 4, MIN_VAL, MAX_VAL, (base_array[i * interval]));
  }
  delta = ((base_array[0]) - (base_array[15 * interval]));  //We calculate the delta (pressure change) for the selected interval
  screen_data (value, delta, (interval * 3));               //Displaying text information on the screen
}

void screen_data (int value, int delta, byte interval) {    //The function of displaying text information on the screen (everything except for the chart bars)
  lcd.setCursor(16, 0);
  lcd.print(value);
  lcd.setCursor(17, 2);
  if (delta == value) delta = 0;
  if (delta > 0) {
    lcd.print("+");
  } else if (delta < 0) {
    lcd.print("-");
  } else if (delta == 0) {
    lcd.print(" ");
  }
  lcd.setCursor(18, 2);
  lcd.print(abs(delta));
  if (abs(delta) < 10) {
    lcd.setCursor(19, 2);
    lcd.print(" ");
  }
  lcd.setCursor(17, 1);
  lcd.print("hPa");
  lcd.setCursor(17, 3);
  lcd.print(interval);
  (interval < 10) ? lcd.print("h ") : lcd.print("h");
}

void initPlot() {
  // necessary symbols for work
  // created in http://maxpromer.github.io/LCD-Character-Creator/
  byte row8[8] = {0b11111,  0b11111,  0b11111,  0b11111,  0b11111,  0b11111,  0b11111,  0b11111};
  byte row7[8] = {0b00000,  0b11111,  0b11111,  0b11111,  0b11111,  0b11111,  0b11111,  0b11111};
  byte row6[8] = {0b00000,  0b00000,  0b11111,  0b11111,  0b11111,  0b11111,  0b11111,  0b11111};
  byte row5[8] = {0b00000,  0b00000,  0b00000,  0b11111,  0b11111,  0b11111,  0b11111,  0b11111};
  byte row4[8] = {0b00000,  0b00000,  0b00000,  0b00000,  0b11111,  0b11111,  0b11111,  0b11111};
  byte row3[8] = {0b00000,  0b00000,  0b00000,  0b00000,  0b00000,  0b11111,  0b11111,  0b11111};
  byte row2[8] = {0b00000,  0b00000,  0b00000,  0b00000,  0b00000,  0b00000,  0b11111,  0b11111};
  byte row1[8] = {0b00000,  0b00000,  0b00000,  0b00000,  0b00000,  0b00000,  0b00000,  0b11111};
  lcd.createChar(0, row8);
  lcd.createChar(1, row1);
  lcd.createChar(2, row2);
  lcd.createChar(3, row3);
  lcd.createChar(4, row4);
  lcd.createChar(5, row5);
  lcd.createChar(6, row6);
  lcd.createChar(7, row7);
}

                                              //Diagram drawing, code taken from Guyver https://alexgyver.ru/lcd-plots-and-bars/
void drawPlot(byte pos, byte row, byte width, byte height, int min_val, int max_val, int fill_val) {

  for (byte i = 0; i < width; i++) {
    plot_array[i] = plot_array[i + 1];
  }
  fill_val = constrain(fill_val, min_val, max_val);
  plot_array[width - 1] = fill_val;
  for (byte i = 0; i < width; i++) {         // each parameter column
    int infill, fract;

                                             // find the number of whole blocks, taking into account the minimum and maximum, to display on the chart
    infill = floor((float)(plot_array[i] - min_val) / (max_val - min_val) * height * 10);
    fract = (infill % 10) * 8 / 10;                          // find the number of remaining stripes
    infill = infill / 10;
    for (byte n = 0; n < height; n++) {     // for all graph lines
      if (n < infill && infill > 0) {       // while we're below the level
        lcd.setCursor(i, (row - n));        // fill in cells
        lcd.write(0);
      }
      if (n >= infill) {                          // if you reach the level
        lcd.setCursor(i, (row - n));
        if (fract > 0) lcd.write(fract);          // заполняем дробные ячейки
        else lcd.write(16);                       // if fractional == 0, fill empty
        for (byte k = n + 1; k < height; k++) {   // everything that is on top is filled with empty
          lcd.setCursor(i, (row - k));
          lcd.write(16);
        }
        break;
      }
    }
  }
}

void update_all () {                             //Обновляем данные в EEPROM
  eeprom_update_block((void*)&base_array, 0, sizeof(base_array));
}

void read_all () {                              //Reading data from EEPROM
  eeprom_read_block((void*)&base_array, 0, sizeof(base_array));
}
Arduino Barometer + Barograph with BME280 Sensor


Raspberry Pi 5 7 Inch Touch Screen IPS 1024x600 HD LCD HDMI-compatible Display for RPI 4B 3B+ OPI 5 AIDA64 PC Secondary Screen(Without Speaker)
BUY NOW


- Comments(0)
- Likes(1)
More by Mirko Pavleski
-
 Arduino 3D Printed self Balancing Cube
Self-balancing devices are electronic devices that use sensors and motors to keep themselves balanc...
Arduino 3D Printed self Balancing Cube
Self-balancing devices are electronic devices that use sensors and motors to keep themselves balanc...
-
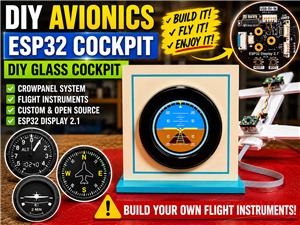 DIY Avionics Simulator with ESP32 - Artificial Horizon, Compass & Altimeter
The inspiration for this project comes from classical aircraft cockpit instruments used for navigat...
DIY Avionics Simulator with ESP32 - Artificial Horizon, Compass & Altimeter
The inspiration for this project comes from classical aircraft cockpit instruments used for navigat...
-
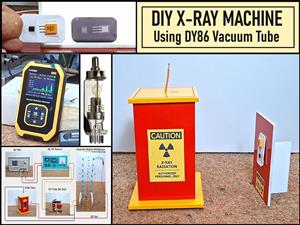 DIY Miniature X-Ray Machine using a TV Vacuum Tube DY86
An X-ray machine (or radiograph) is a quick, painless medical test that produces images of the struc...
DIY Miniature X-Ray Machine using a TV Vacuum Tube DY86
An X-ray machine (or radiograph) is a quick, painless medical test that produces images of the struc...
-
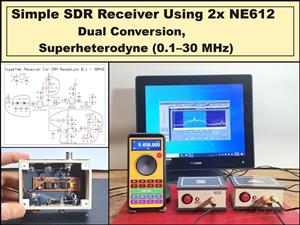 Simple SDR Receiver Using 2x NE612 - Dual Conversion, Superheterodyne (0.1–30 MHz)
SDR (Software Defined Radio) is a radio system in which most of the functions of a classic radio (f...
Simple SDR Receiver Using 2x NE612 - Dual Conversion, Superheterodyne (0.1–30 MHz)
SDR (Software Defined Radio) is a radio system in which most of the functions of a classic radio (f...
-
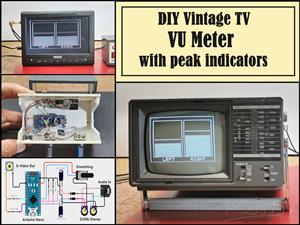 DIY Vintage TV VU Meter with peak indicators
Some time ago in one of my projects I presented you a way to turn a black and white old mini TV int...
DIY Vintage TV VU Meter with peak indicators
Some time ago in one of my projects I presented you a way to turn a black and white old mini TV int...
-
 DIY Tesla Coil based Plasma Rife Machine
In several of my previous videos, I presented you with different ways to make a Rife Machine, from ...
DIY Tesla Coil based Plasma Rife Machine
In several of my previous videos, I presented you with different ways to make a Rife Machine, from ...
-
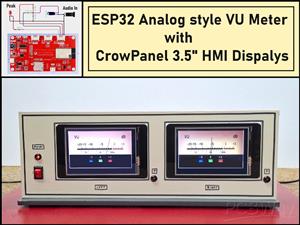 ESP32 Analog VU Meter – Smooth Needle, Real Audio Response (DIY Build)
In several of my previous videos I have shown you how to make analog VU meters emulated on differen...
ESP32 Analog VU Meter – Smooth Needle, Real Audio Response (DIY Build)
In several of my previous videos I have shown you how to make analog VU meters emulated on differen...
-
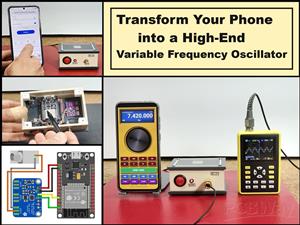 The Ultimate Smartphone VFO ESP32 & Si5351 Wireless Control
Variable frequency oscillators (VFOs) are commonly used in radio transmitters and receivers, especi...
The Ultimate Smartphone VFO ESP32 & Si5351 Wireless Control
Variable frequency oscillators (VFOs) are commonly used in radio transmitters and receivers, especi...
-
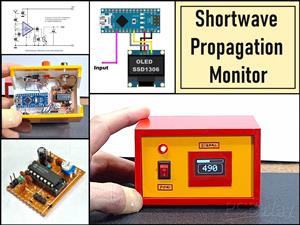 DIY Shortwave Propagation Monitor - Measure Ionosphere Conditions
Shortwave Propagation is the way radio waves in the 3 to 30 MHz range travel from point A to point ...
DIY Shortwave Propagation Monitor - Measure Ionosphere Conditions
Shortwave Propagation is the way radio waves in the 3 to 30 MHz range travel from point A to point ...
-
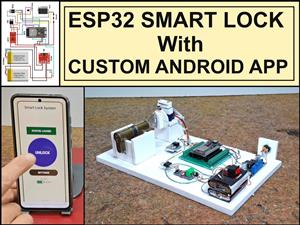 Professional grade Smart Lock with ESP32, BLE and Android App Control
An electronic codelock is a security device that grants access using a numerical sequence—a PIN cod...
Professional grade Smart Lock with ESP32, BLE and Android App Control
An electronic codelock is a security device that grants access using a numerical sequence—a PIN cod...
-
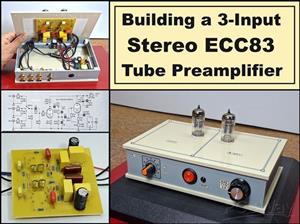 Building a 3-Input Stereo ECC83 (12AX7) Tube Preamp
Some time ago I presented you a project for a 3W stereo tube amplifier with a GU32 output vacuum t...
Building a 3-Input Stereo ECC83 (12AX7) Tube Preamp
Some time ago I presented you a project for a 3W stereo tube amplifier with a GU32 output vacuum t...
-
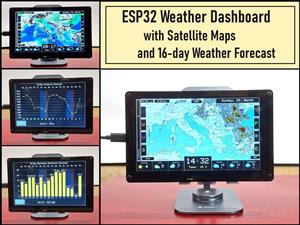 ESP32 Weather Dashboard with Satellite Maps and 16-day Weather Forecast
As you can see from my previous videos, besides Electronics, my fields of experimentation and proje...
ESP32 Weather Dashboard with Satellite Maps and 16-day Weather Forecast
As you can see from my previous videos, besides Electronics, my fields of experimentation and proje...
-
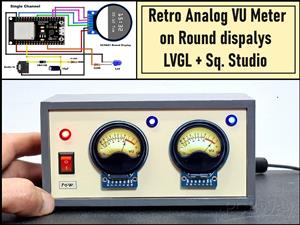 Retro Analog VU Meter on Round dispalys (ESP32 and GC9A01)
Recently, in one of my previous videos I presented you a Retro VU Meter project on round displays ...
Retro Analog VU Meter on Round dispalys (ESP32 and GC9A01)
Recently, in one of my previous videos I presented you a Retro VU Meter project on round displays ...
-
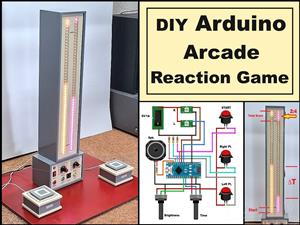 Ultimate 2-Player Reaction Timer with WS2812B LED Strips & Arduino
Arcade reaction game is a genre of play designed to test a player's physical response time and hand...
Ultimate 2-Player Reaction Timer with WS2812B LED Strips & Arduino
Arcade reaction game is a genre of play designed to test a player's physical response time and hand...
-
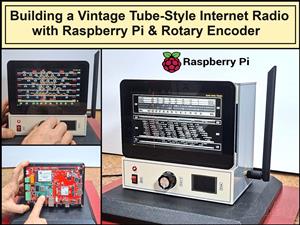 Building a Vintage Tube-Style Internet Radio with Raspberry Pi & Rotary Encoder
Internet radio (also known as web radio or net radio) is a digital audio service transmitted via th...
Building a Vintage Tube-Style Internet Radio with Raspberry Pi & Rotary Encoder
Internet radio (also known as web radio or net radio) is a digital audio service transmitted via th...
-
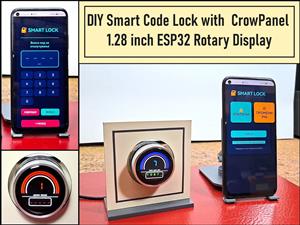 DIY Smart Code Lock with CrowPanel 1.28 ESP32 Rotary Display
A code lock is a keyless security device—either mechanical or electronic—that restricts access to d...
DIY Smart Code Lock with CrowPanel 1.28 ESP32 Rotary Display
A code lock is a keyless security device—either mechanical or electronic—that restricts access to d...
-
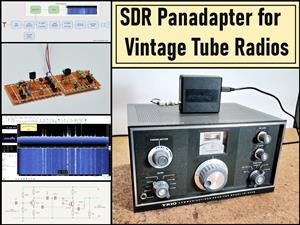 SDR Panadapter for Vintage Tube Radios – Step-by-Step Tutorial
A radio panadapter (or panoramic adapter) is a device or software tool used in amateur radio and ot...
SDR Panadapter for Vintage Tube Radios – Step-by-Step Tutorial
A radio panadapter (or panoramic adapter) is a device or software tool used in amateur radio and ot...
-
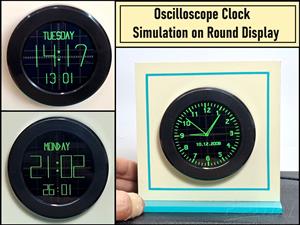 Oscilloscope Clock Simulation on a Round ESP32 Display
An oscilloscope clock is a circuit that turns an old analog oscilloscope into a stylish, retro-them...
Oscilloscope Clock Simulation on a Round ESP32 Display
An oscilloscope clock is a circuit that turns an old analog oscilloscope into a stylish, retro-them...
-
Programmable Mist Maker - XIAO / QT PY Extension
446 0 0 -
RadioHAT - Raspberry Pi radio development platform
345 0 1 -
-
-
-
-
ARPS-2 – Arduino-Compatible Robot Project Shield for Arduino UNO
2896 0 6 -
A Compact Charging Breakout Board For Waveshare ESP32-C3
3397 3 8 -
AI-driven LoRa & LLM-enabled Kiosk & Food Delivery System
3723 2 2