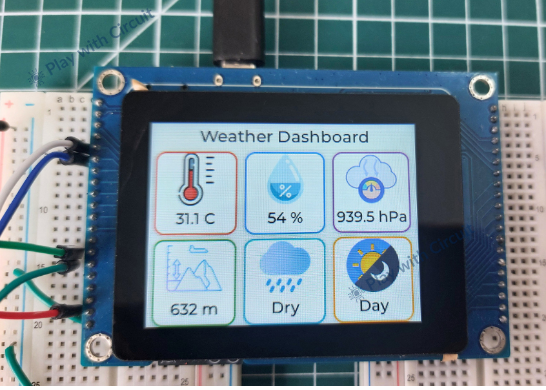
ESP32-S3 Smart Weather Station with Touchscreen Dashboard and LVGL
Weather monitoring is a useful way to combine sensors, embedded programming, and a graphical user interface into one practical project. In this build, an ESP32-S3-based smart display is used to create a compact touchscreen weather station that can monitor several environmental conditions in real time.
The system measures temperature, humidity, atmospheric pressure, altitude, rainfall condition, and ambient light level. Instead of using a conventional ESP32 development board together with a separate display, the project uses a 2.8-inch VIEWE ESP32-S3 Smart Display, which provides both the processing hardware and touchscreen interface.
Three external sensors are connected to the display. A BME280 provides the main environmental measurements, a rain sensor identifies wet or dry conditions, and an LDR sensor is used to distinguish between day and night.
The sensor information is processed by the ESP32-S3 and presented through a graphical dashboard created with LVGL (Light and Versatile Graphics Library). This makes the project more than a basic sensor-reading experiment; it demonstrates how an ESP32-S3 can combine sensor acquisition, data processing, and an embedded GUI in one application.
Project Concept
The basic idea is straightforward: collect environmental information, process it inside the ESP32-S3, and present the result on the touchscreen.
The BME280 communicates digitally with the ESP32-S3. It provides temperature, humidity, and atmospheric pressure readings. The pressure value is also used by the application to calculate altitude.
The rain sensor operates differently. Its conductive sensing surface changes electrically when water comes into contact with it. The ESP32-S3 monitors the sensor's analog output and uses the measured level to determine whether the surface indicates rainy or dry conditions.
The LDR provides another analog signal. Since an LDR changes resistance according to the amount of incident light, its output can be used to determine the surrounding illumination. The software compares this reading against predefined thresholds to identify day or night.
All three measurements are periodically processed by the ESP32-S3. The resulting information is then sent to the LVGL-based interface, where the user can see the current environmental conditions.
System Architecture
The project can be considered as four connected sections.
The first section is the sensing layer, consisting of the BME280, rain sensor, and LDR. These components collect different types of environmental information.
The second section is the ESP32-S3 processing unit integrated into the smart display. It communicates with the BME280 through I2C and reads the rain and light sensors through ADC inputs.
The third section is the data-processing layer. Here, raw sensor readings are converted into useful values such as temperature, humidity, pressure, altitude, rain status, and day/night status.
Finally, the LVGL interface presents the processed information on the 2.8-inch TFT touchscreen.
This architecture keeps the project relatively simple because the display and microcontroller are already integrated into the same hardware module.
Environmental Sensors
BME280
The BME280 is the primary environmental sensor in this project. It measures temperature, humidity, and atmospheric pressure. The pressure measurement can also be used to derive altitude.
The sensor communicates with the ESP32-S3 using the I2C protocol, which requires separate data and clock lines in addition to power and ground.
In this project, the BME280 sensor's SDA line is connected to GPIO9, while SCL is connected to GPIO10.
The ESP32-S3 periodically reads the sensor and makes the resulting temperature, humidity, pressure, and altitude information available to the dashboard.
Rain Sensor
The rain sensor detects water using a conductive sensing plate. When the surface is dry, its electrical characteristics differ from those when water droplets bridge the conductive tracks.
The sensor's analog output is connected to GPIO7 of the ESP32-S3. GPIO7 is configured as an ADC input so the controller can continuously measure the sensor output.
The application uses the measured analog level to determine whether the sensor indicates a dry condition or rainfall.
LDR Light Sensor
An LDR, or light-dependent resistor, is used to monitor ambient illumination.
Its resistance changes according to the amount of light reaching the sensor. In brighter conditions, the resistance decreases, while reduced illumination causes the resistance to increase.
The LDR module provides an analog output that is connected to GPIO6. The ESP32-S3 reads this value through its ADC and compares it with predefined threshold values to identify whether the current condition corresponds to daytime or nighttime.
Why Use LVGL?
A sensor project can display values through a serial monitor, but a touchscreen interface makes the system much easier to use as a standalone device.
LVGL is an open-source graphics framework designed for embedded systems. It provides graphical objects such as labels, images, buttons, and other interface elements without requiring developers to build every GUI component from scratch.
For this weather station, LVGL is responsible for creating the dashboard displayed on the ESP32-S3 screen. Sensor readings are presented using labels and information areas, while weather-related graphics provide a visual representation of the current conditions.
The interface is continuously updated as new sensor data becomes available, turning the ESP32-S3 into a small real-time monitoring terminal.
Hardware Required
The main hardware is the VIEWE 2.8-inch ESP32-S3 Smart Display, which serves as the controller and touchscreen display.
The project also requires a 7Semi BME280 sensor, a rain sensor, and an LDR/light sensor. Jumper wires are used for the connections, while two breadboards can be used during prototyping.
A USB cable is required to connect the smart display to a computer for firmware development and programming.
Software Environment
The project uses Visual Studio Code together with the ESP-IDF extension.
The original project specifies Visual Studio Code v1.116.0 or later, ESP-IDF extension v1.11.1 or later, and ESP-IDF v5.3.5.
Python v3.11.2 is also required. The Bosch BME280 library is included with the source package, while the required LVGL display port uses LVGL v8.4.0.
When installing the required software, use the default installation location recommended by the installer.
Wiring the Weather Station
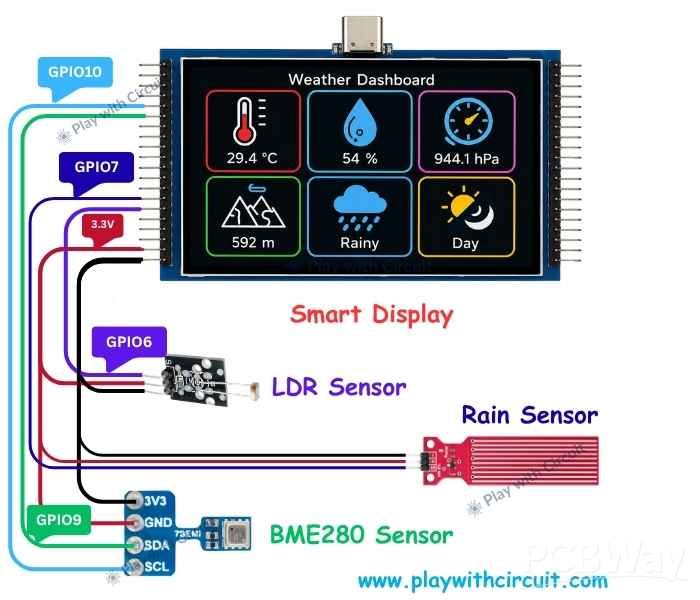
The sensor connections are simple because the project uses only one I2C sensor and two analog sensors.
For the BME280, connect VCC to the 3.3V output of the ESP32-S3 Smart Display and GND to GND. Connect SDA to GPIO9 and SCL to GPIO10.
For the rain sensor, connect VCC to 3.3V and GND to the common ground. Its analog output, AO, connects to GPIO7.
For the LDR module, VCC is connected to 3.3V, GND is connected to the common ground, and AO is connected to GPIO6.
All three sensors operate from the 3.3V supply provided by the smart display. Their ground connections must be shared with the ESP32-S3.
How the Data Moves Through the System
Once the hardware is powered, the ESP32-S3 begins acquiring sensor readings.
The BME280 supplies temperature, humidity, pressure, and altitude information. The rain sensor provides an analog value representing the condition of its sensing surface. The LDR provides another analog value representing ambient light.
The ESP32-S3 processes these readings before sending them to the graphical interface.
The resulting dashboard can therefore show:
- Current temperature
- Relative humidity
- Atmospheric pressure
- Calculated altitude
- Rain status
- Day/night condition
Because the readings are updated continuously, the display provides a live view of the monitored environment.
Preparing the Project
The complete source code is provided as a ZIP package at Play with Circuit. Before opening the project, make sure the ESP-IDF environment and other required software have been installed.
After extracting the package, locate the lvgl_v8_port directory inside the project.
The relevant folder structure is:
007_WeatherMonitoring
└── ESP32_Display_Panel
└── examples
└── esp_idf
└── lvgl_v8_port
Open the lvgl_v8_port folder directly in Visual Studio Code.
Cleaning the ESP-IDF Project
Before starting a new build, remove the previously generated build, managed_components, and dependencies.lock files or folders if they exist.
The ESP-IDF extension can then be used from the VS Code status bar to clean and rebuild the project.
If the extension does not automatically detect the required configuration, manually select the ESP32-S3 target, the correct serial COM port, and the appropriate ESP-IDF toolchain.
A clean build is useful here because it prevents previously generated build information from interfering with the current project configuration.
Compiling and Flashing
After the project configuration is ready, start the build process from the ESP-IDF controls in Visual Studio Code.
Wait for the compilation to complete successfully. Once there are no build errors, connect the ESP32-S3 Smart Display to the computer through its USB Type-C connection.
Use the Flash Device option from the ESP-IDF toolbar to upload the firmware.
After the flashing process finishes, the weather monitoring application should start on the smart display.
Understanding the Source Code
The project contains the normal ESP-IDF framework files, display components, libraries, and dependencies. The application-specific code is primarily located in the main directory.
main.cpp
The main.cpp file is responsible for the main application flow.
It initializes the ESP32-S3 Smart Display and configures the LVGL graphical interface. It also initializes the BME280, sets up the ADC channels required for the rain and LDR sensors, and reads the environmental data.
The file also handles the processing required to determine rain and day/night conditions. It creates the weather dashboard and continuously refreshes the values displayed on the screen.
Sensor communication errors are also handled by the application so that the interface can report problems when required.
sensors.c
The sensors.c file contains the sensor-related functionality.
It handles BME280 measurements, including temperature, humidity, atmospheric pressure, and altitude calculation. It also reads the analog outputs from the rain sensor and LDR.
The file contains the routines required to determine rain status and day/night status and provides the processed sensor information to the main application and graphical interface.
Keeping these functions separate from the main display logic makes the application easier to manage and understand.
Testing the System
Testing can be performed sensor by sensor before relying on the complete dashboard.
First, verify that the BME280 is detected correctly and that temperature, humidity, pressure, and altitude values are being updated.
Next, expose the rain sensor to a small amount of water and observe whether its analog reading changes and whether the software updates the rain condition.
The LDR can then be tested by changing the amount of light reaching its surface. The displayed day/night condition should change according to the configured threshold.
Finally, verify that all values are being refreshed correctly on the LVGL dashboard.
Conclusion
This ESP32-S3 weather monitoring project combines three different sensing methods with a touchscreen graphical interface. The BME280 handles the primary environmental measurements, while the rain sensor and LDR provide additional information about rainfall and ambient lighting.
Using the VIEWE ESP32-S3 Smart Display eliminates the need for a separate controller and display, while LVGL provides a flexible way to build the monitoring dashboard.
The project is also a useful starting point for developing a more permanent hardware version. Once the prototype has been validated, the same circuit can be adapted to a custom PCB with dedicated sensor connectors and cleaner power and signal routing.
Overall, the build provides practical experience with ESP32-S3, ESP-IDF, ADC inputs, environmental sensors, touchscreen displays, LVGL, and embedded GUI development.
The complete original implementation and additional technical details are available on Play with Circuit.
ESP32-S3 Smart Weather Station with Touchscreen Dashboard and LVGL


Raspberry Pi 5 7 Inch Touch Screen IPS 1024x600 HD LCD HDMI-compatible Display for RPI 4B 3B+ OPI 5 AIDA64 PC Secondary Screen(Without Speaker)
BUY NOW


- Comments(0)
- Likes(0)
 More by Engineer
-
Émetteur Récepteur Optique Expérimental (communication UART ATtiny + fibre optique)
37 0 1 -
SmallOLED - Live PC Stats, Animated Clocks & Audio Visualizer
868 0 3 -
"Talking Multimeter": Arduino-Based Speech Add-on for Multimeters with SCPI Protocol
509 0 1 -
Programmable Mist Maker - XIAO / QT PY Extension
2976 2 3 -
RadioHAT - Raspberry Pi radio development platform
2524 0 4 -
-
-