Summary: Via MKR GSM 1400, collate water quality data from resources over GPRS to train a Neuton model, run the model, and transmit results via SMS.
In this project, I focused on developing an AI-driven budget-friendly device to collect water quality data from various water resources in the field and forecast water pollution levels based on oxidation-reduction potential (ORP), pH, total dissolved solids (TDS), and turbidity measurements.
📌 Why is water pollution a global issue?
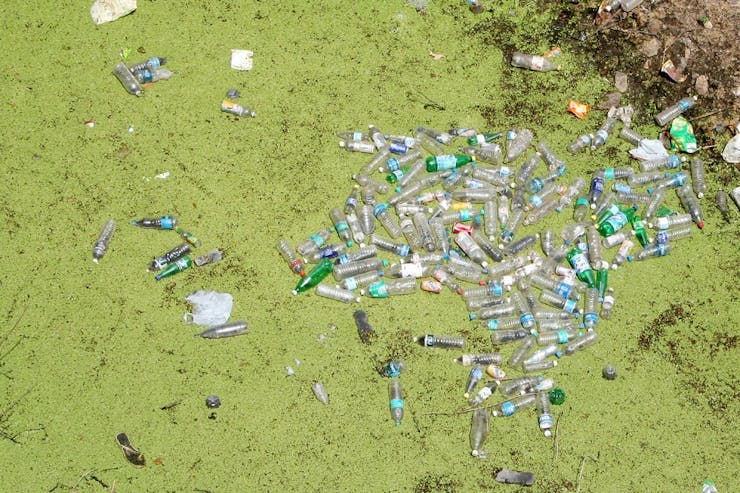
Since we incessantly pollute our limited water resources, which are already drowning in chemicals, waste, plastic, and other contaminants, it is crucial to eschew water pollution before it is too late for relieving the plight of people lacking safe drinking water. Although there are international efforts and campaigns to plummet water contaminants, it is yet a pressing issue to track water pollution levels locally to get prescient warnings regarding possible health and environmental risks.
In addition to threatening terrestrial animals, plants, and marine life, water pollution is jeopardizing our health. Unsafe water kills more people each year than war and all other forms of violence combined. Meanwhile, our drinkable water sources are meager: Less than 1 percent of the Earth's clean (fresh) water is actually accessible to us. Without action, the challenges will only increase by 2050, when global demand for freshwater is inferred to be one-third greater than it is now[1]. We may even have less time than expected since water is uniquely susceptible to pollution. Water is widely described as the universal solvent since it can dissolve more substances than any other liquid on the Earth. Hence, harmful and toxic substances, mostly chemicals or microorganisms, can effortlessly contaminate a stream, river, lake, ocean, aquifer, or other body of water, degrading water quality and rendering it toxic to humans or the environment.
📌 Water quality measurements to detect water pollution
After perusing recent research papers on water pollution, I decided to utilize oxidation-reduction potential (ORP), pH, total dissolved solids (TDS), and turbidity measurements denoting water pollution (contamination) so as to create a budget-friendly device to forecast water pollution levels locally in the hope of obviating the need for expensive equipment to detect contamination and forfend perilous pollution effects.
Oxidation-reduction potential (ORP) is a measurement of ion exchange: Chemical substances with a negative ORP value can donate extra ions, but positive ORP values lead to ion absorption. When the ORP value is high in the water, bacteria decompose dead tissue and contaminants more efficiently. In general, the higher the ORP value, the healthier the body of water is. However, ORP values decrease closer to the bottom sediments, even in clean water resources, since many bacteria are working hard in the lower sediments to decompose dead tissue. Therefore, they use up most of the available oxygen. Since oxygen disappears quickly in the bottom mud (often within a centimeter or two), ORP values decrease quickly[2].
The pH is of importance in determining the corrosivity of water, but the relationship with several other parameters is complex. Natural waters contain gases, colloidal matter, and a variety of electrolyte and non-electrolyte material, and these, together with pH, determine the extent of corrosion in a system. However, in general, the lower the pH, the higher the potential level of corrosion. The pH of most drinking water lies within the range of 6.5–8.5. Natural waters can be of lower pH, for example, as a result of acid rain or higher pH in limestone areas[3].
Total dissolved solids (TDS) is the term used to describe the inorganic salts and small amounts of organic matter present in solution in water. The principal constituents are usually calcium, magnesium, sodium, and potassium cations and carbonate, hydrogencarbonate (bicarbonate), chloride, sulfate, and nitrate anions. TDS in water supplies originates from natural sources, sewage, urban and agricultural run-off, and industrial wastewater. Salts used for road de-icing can also contribute to the TDS loading of water supplies[4].
Turbidity in water is caused by suspended particles or colloidal matter that obstruct light transmission through the water. It may be caused by inorganic or organic matter or a combination of the two. Microorganisms (bacteria, viruses, and protozoa) are typically attached to particulates, and removal of turbidity by filtration will significantly reduce microbial contamination in treated water. Turbidity is measured by nephelometric turbidity units (NTU) and can be initially noticed by the naked eye above approximately 4.0 NTU. However, to ensure the efficacy of disinfection, the turbidity should be no more than 1 NTU and preferably much lower[5].
📌 Why did I need to build a neural network model to forecast water pollution?
Although ORP, pH, TDS, and turbidity measurements provide insight into detecting water pollution, it is not possible to extrapolate and interpret water pollution levels accurately by merely employing limited data without applying complex algorithms since water pollution levels fluctuate according to various phenomena. Therefore, I decided to build and train an artificial neural network model by utilizing the experimentally assigned pollution classes to predict water pollution levels based on ORP, pH, TDS, and turbidity measurements.
📌 Why did I design my device based on the Arduino MKR GSM 1400?
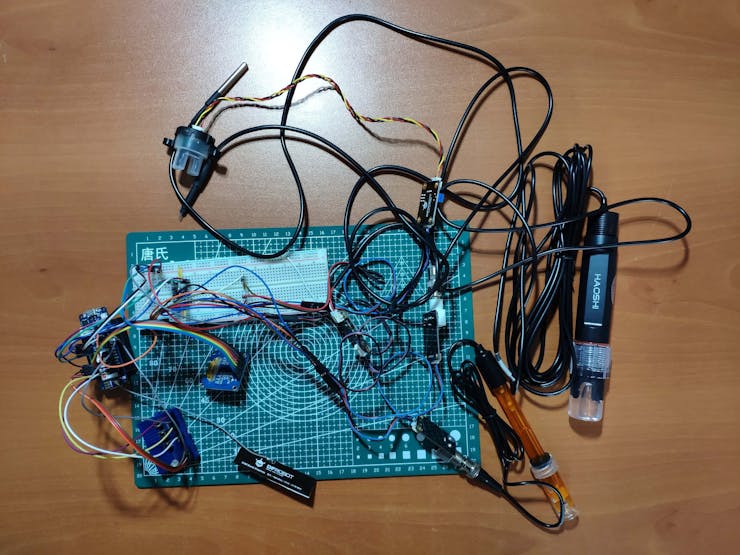
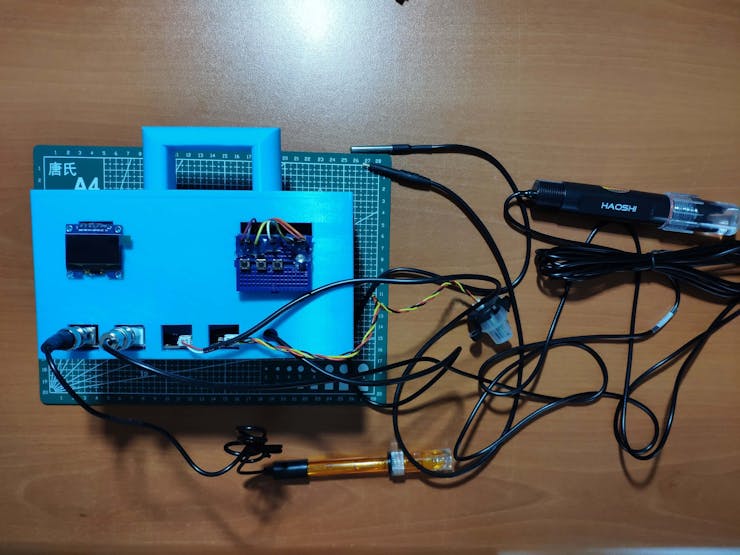
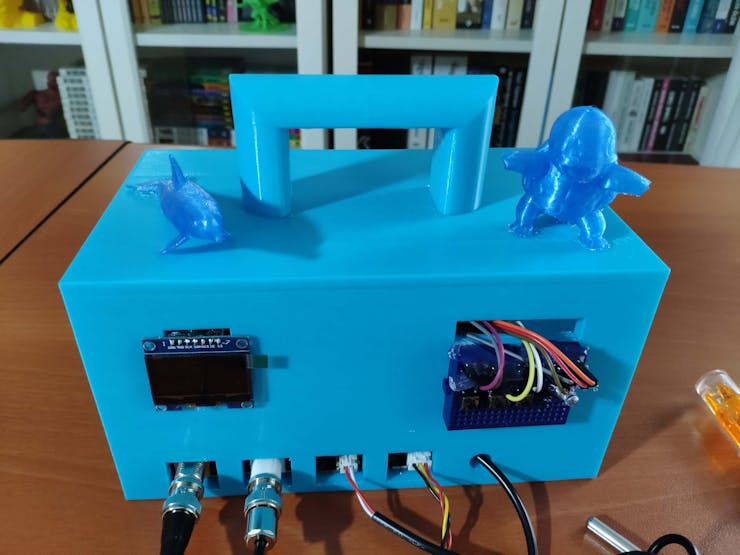
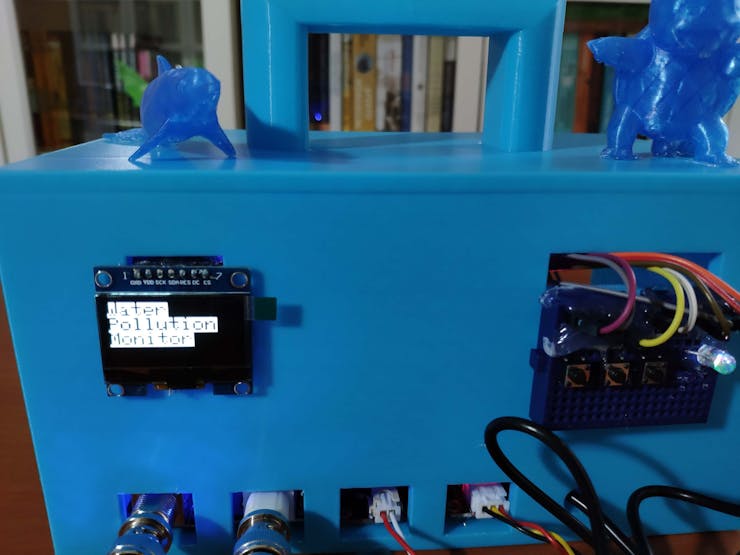
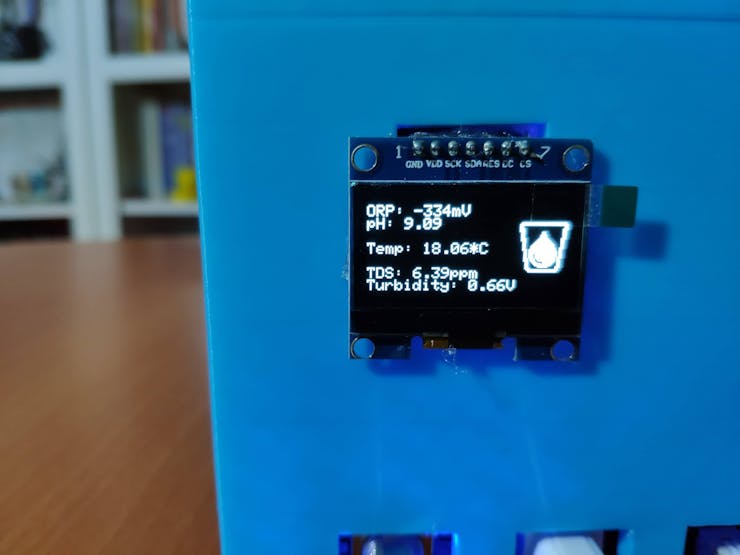
Since I needed to collect data from water resources in the field to create a valid data set, I decided to employ an Arduino MKR GSM 1400 compatible with GPRS. To obtain ORP, pH, TDS, and turbidity measurements, I connected DFRobot water quality sensors and a DS18B20 waterproof temperature sensor to the MKR GSM 1400. Then, I added an SH1106 OLED display to monitor the collected data in the field.
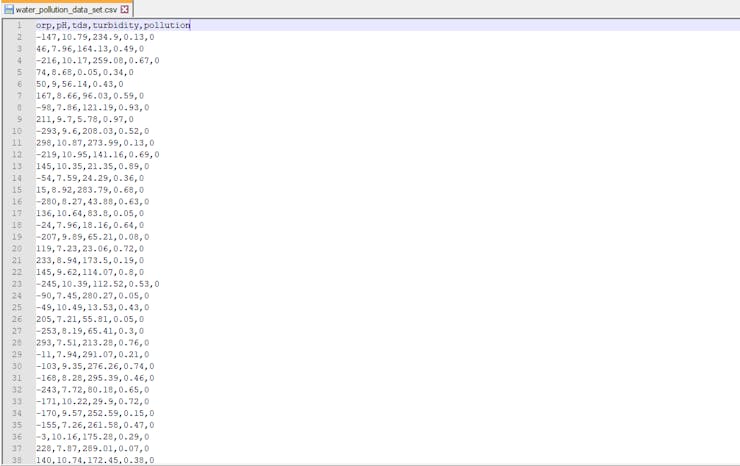
After transmitting data over GPRS successfully, I developed a web application in PHP to log the transferred data in a CSV file before building and training my neural network model. Then, I tested my web application on an Apache server hosted on my Raspberry Pi 4.
📌 Training data and neural network creation
Since the MKR GSM 1400 is not widely preferred to run neural network models, most platforms and official TinyML libraries do not support it. Notwithstanding the foregoing, Neuton supports almost every available microcontroller on the market to run TinyML models effortlessly, thanks to its unique model structure. Therefore, after completing my data set, I built my artificial neural network model (ANN) with Neuton to make predictions on water pollution levels (classes) based on ORP, pH, TDS, and turbidity measurements. As labels, I employed the experimentally assigned water pollution classes for each data record while collecting data in the field:
After training and testing my neural network model, I uploaded and executed the model on the MKR GSM 1400. Therefore, the device is capable of detecting precise water pollution levels (classes) by running the model independently. Also, after running the model successfully, I employed the MKR GSM 1400 to transmit the prediction (detection) result via SMS to a given mobile number.
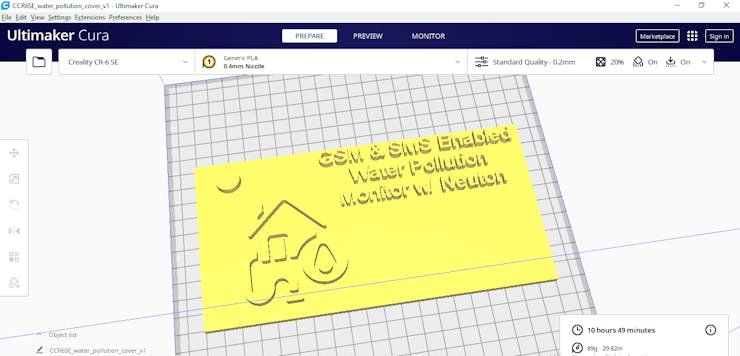
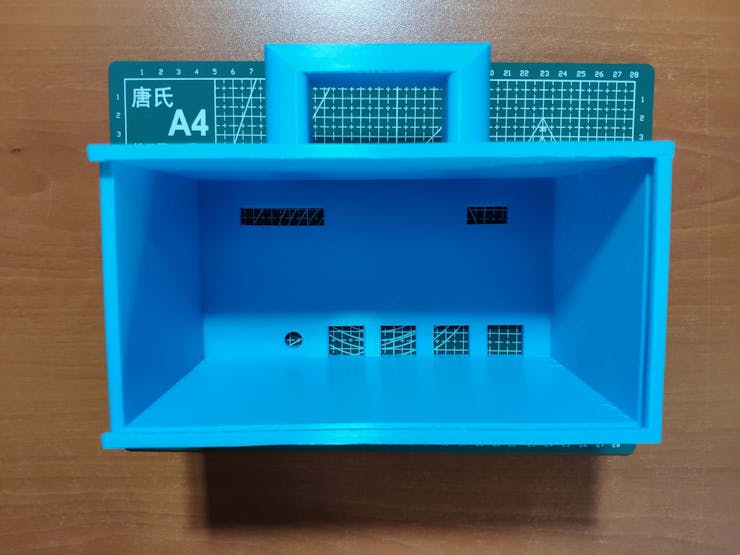
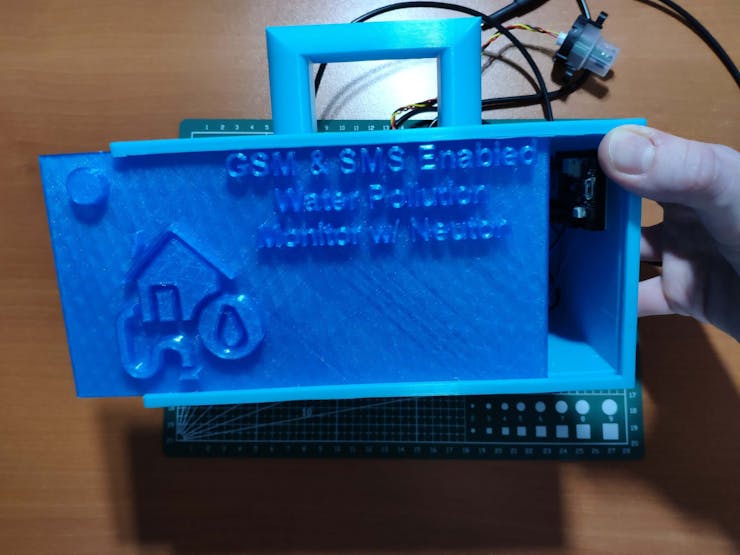
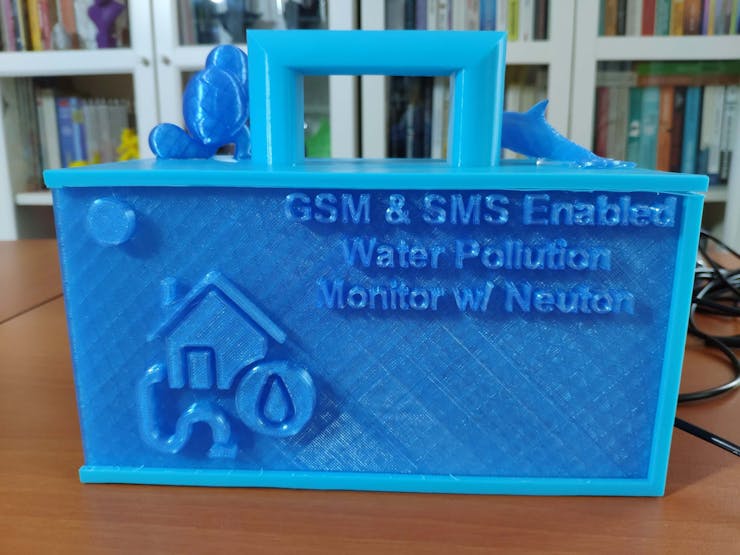
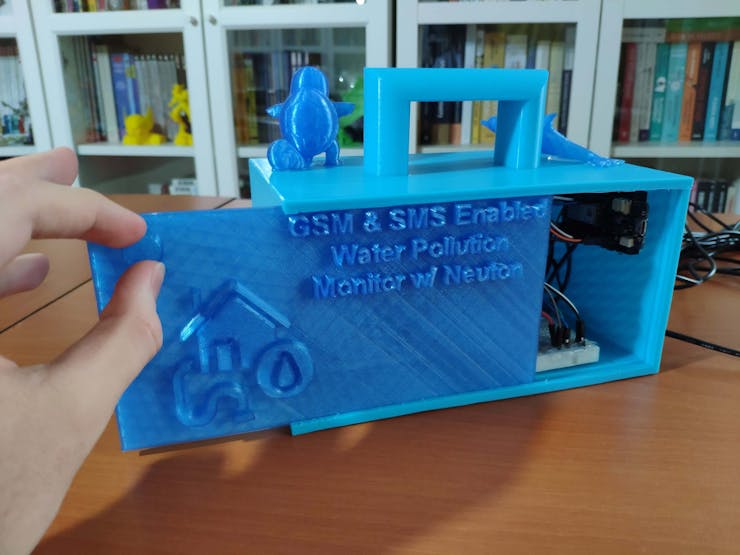
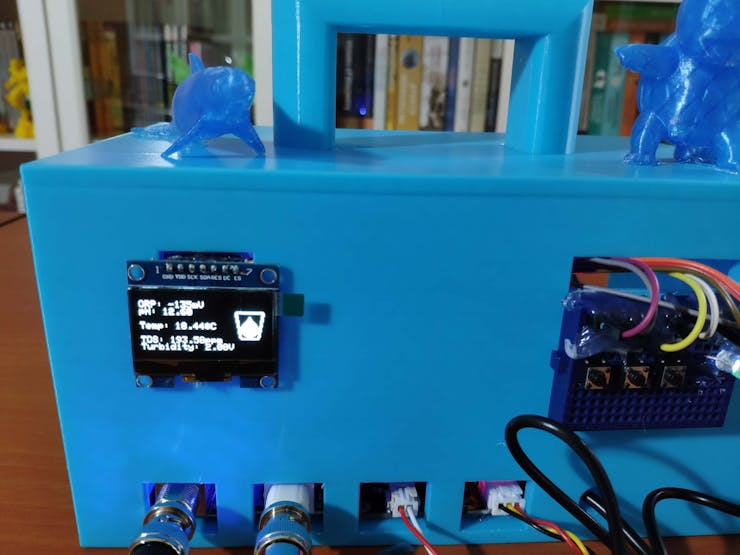
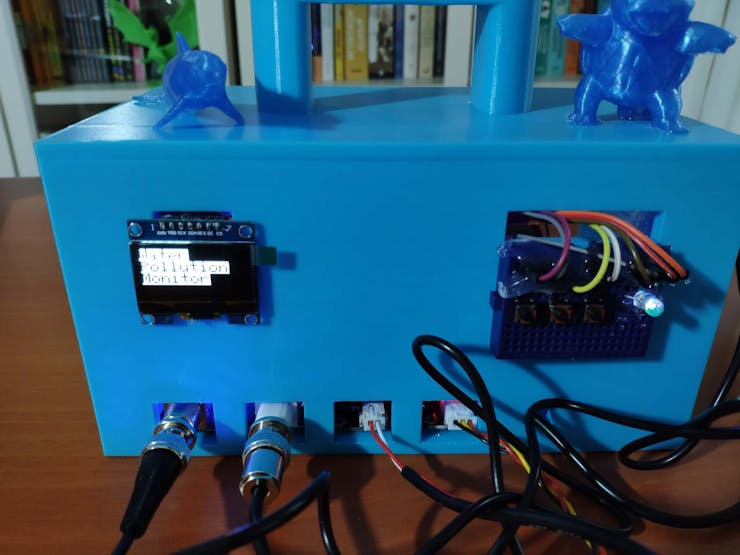
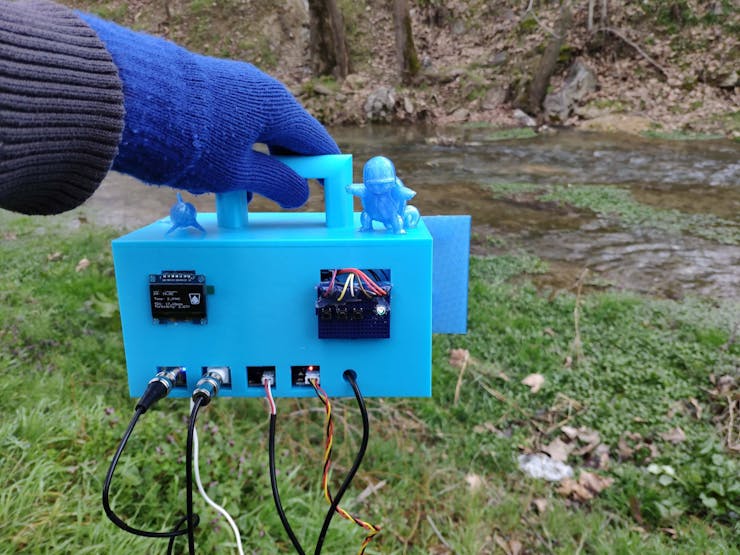
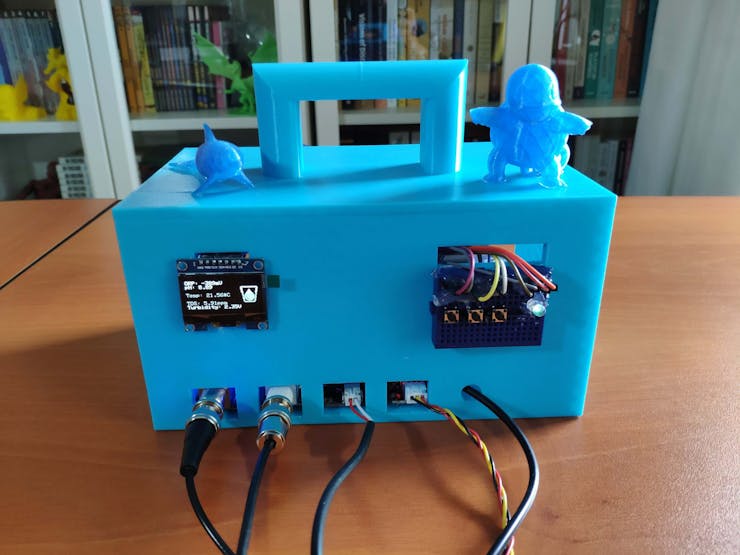
Lastly, to make the device as sturdy and robust as possible while enduring harsh conditions in the field, I designed a Squirtle-themed case with a sliding cover (3D printable).
So, this is my project in a nutshell 😃
In the following steps, you can find more detailed information on coding, logging data over GPRS, building an artificial neural network model with Neuton, and running it on the MKR GSM 1400.
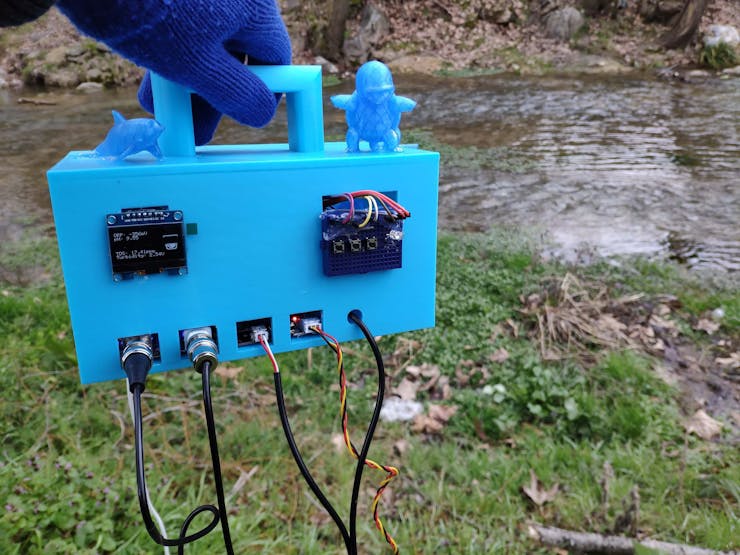
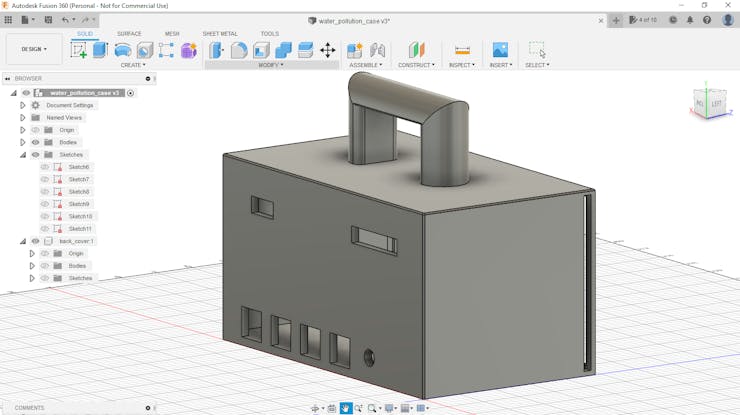
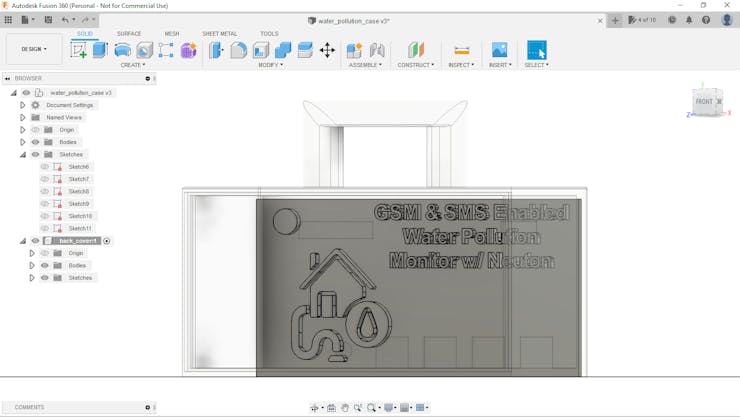
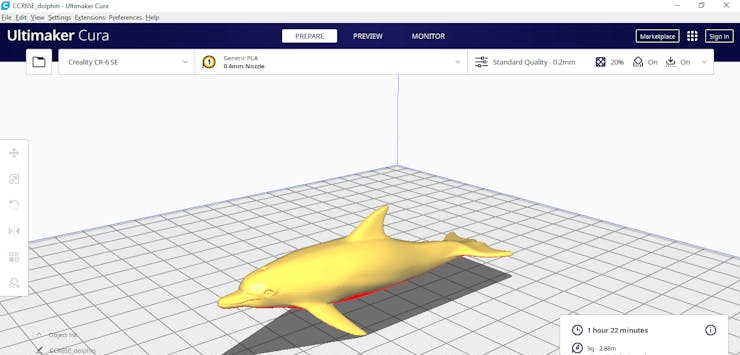
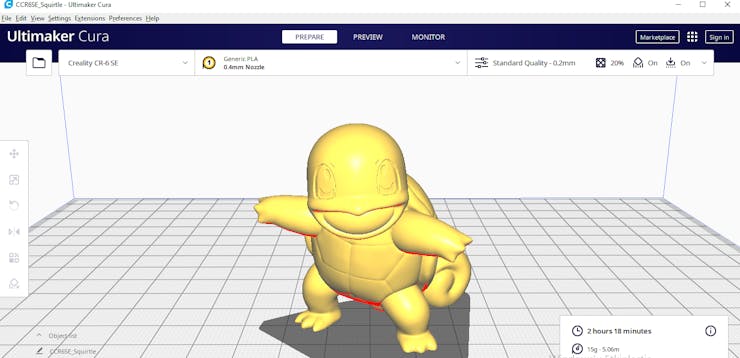
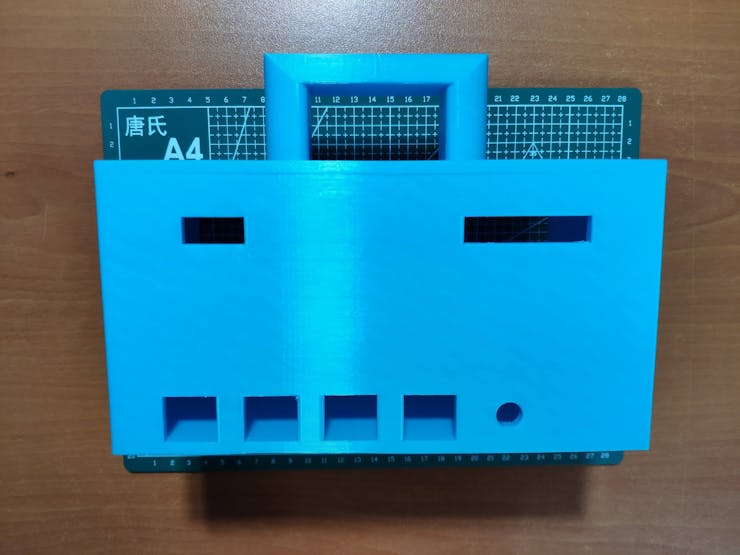
Since I wanted to collect water quality data from water resources and run the model in the field, I decided to design an aqua-inspired case to create a robust and sturdy device flawlessly operating while enduring harsh conditions. Therefore, I added a sliding cover to my case design to avoid overexposure to dust and moisture. Also, I decided to add Squirtle and a dolphin figure to my case in order to emphasize the water theme rapturously.
I designed the main case and its sliding cover in Autodesk Fusion 360. You can download their STL files below.

For the Squirtle and the dolphin figure affixed to the main case, I utilized these models from Thingiverse:
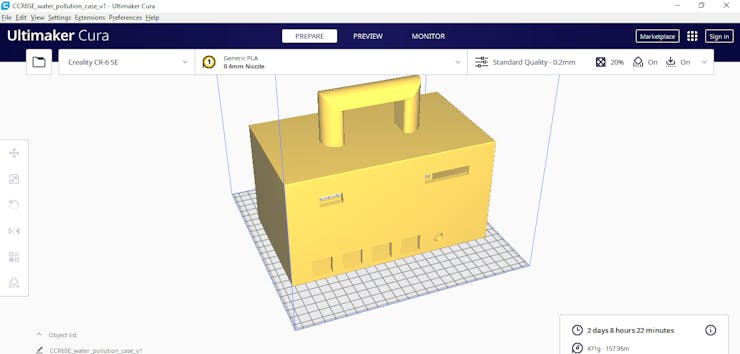
Then, I sliced 3D models (STL files) in Ultimaker Cura.
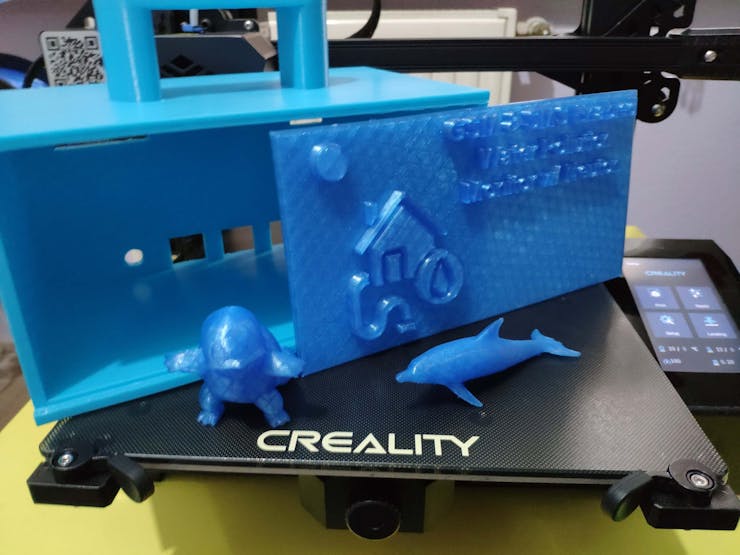
Since I wanted to create a solid structure for the case with the sliding cover and apply a stylish aqua theme to the device, I utilized these PLA filaments:
Finally, I printed all parts (models) with my Creality CR-6 SE 3D Printer. Although I am a novice in 3D printing and it is my first FDM 3D printer, I got incredible results effortlessly with the CR-6 SE :)
// Connections
// Arduino MKR GSM 1400 :
//                                DFRobot Analog ORP Sensor
// A1  --------------------------- Signal
//                                DFRobot Analog pH Sensor Pro Kit
// A2  --------------------------- Signal
//                                DFRobot Analog TDS Sensor
// A3  --------------------------- Signal
//                                DFRobot Analog Turbidity Sensor
// A4  --------------------------- Signal
//                                DS18B20 Waterproof Temperature Sensor
// D1  --------------------------- Data
//                                SH1106 OLED Display (128x64)
// MOSI  ------------------------- SDA
// SCK   ------------------------- SCK
// D10   ------------------------- RST
// D11   ------------------------- DC
// D12   ------------------------- CS
//                                5mm Common Anode RGB LED
// D2  --------------------------- R
// D3  --------------------------- G
// D4  --------------------------- B
//                                Control Button (1)
// D5  --------------------------- +
//                                Control Button (2)
// D6  --------------------------- +
//                                Control Button (3)
// D7  --------------------------- +
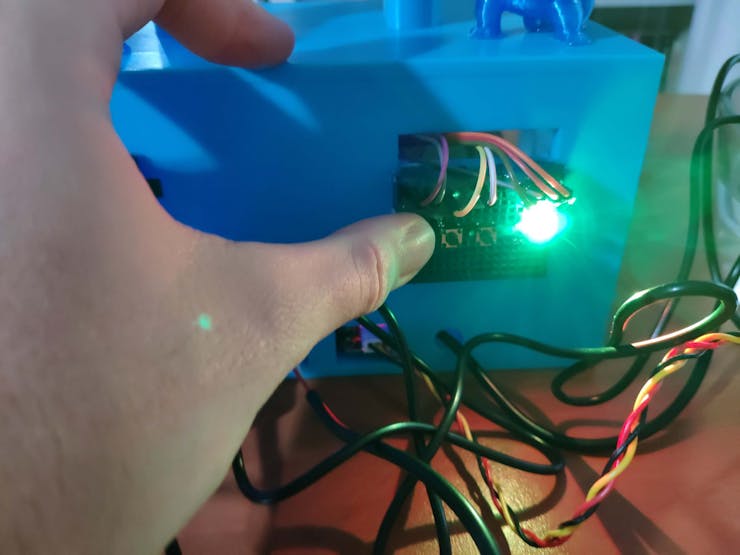
To collect and display water quality data from water resources in the field, I connected the analog ORP sensor, the analog pH sensor, the analog TDS sensor, the analog turbidity sensor, the DS18B20 waterproof temperature sensor, and the SH1106 OLED screen to the MKR GSM 1400. Also, I added a 5mm common anode RGB LED to indicate the outcomes of operating functions and the executed neural network model.
To assign labels while transmitting the collected data and run my neural network model effortlessly, I added three control buttons (6x6), as shown in the schematic below.
Since all connected sensors except the TDS sensor operate at 5V and the Arduino MKR GSM 1400 requires 3.3V logic level voltage, I utilized a bi-directional logic level converter to shift the voltage for the connections between the sensors with 5V output voltage and the MKR GSM 1400.
To calibrate the analog ORP sensor in order to get accurate measurements, press the calibration button on the ORP meter board until seeing a small ORP value printed on the serial monitor, for instance, 8mV. Then according to this value, adjust the offset (orp_offset) variable. Do not calibrate the sensor while the ORP probe is connected to the ORP meter board.
To calibrate the analog pH sensor so as to obtain accurate measurements, put the pH electrode into the standard solution whose pH value is 7.00. Then, record the generated pH value printed on the serial monitor. Finally, adjust the offset (pH_offset) variable according to the difference between the generated and actual pH values, for instance, 0.12 (7.00 - 6.88). The discrepancy should not exceed 0.3. For the acidic calibration, you can inspect the product wiki.
Since the analog TDS sensor needs to be calibrated for compensating temperature to generate reliable measurements, I utilized a DS18B20 waterproof temperature sensor. As shown in the schematic below, a 4.7K resistor is required as a pull-up from the DATA line to the VCC line when using the DS18B20 temperature sensor.
Since I utilized a bi-directional logic level converter to shift the voltage for the connections between the sensors with 5V output voltage and the MKR GSM 1400 from 5V to 3.3V, I applied additional calibration values according to my experiments.
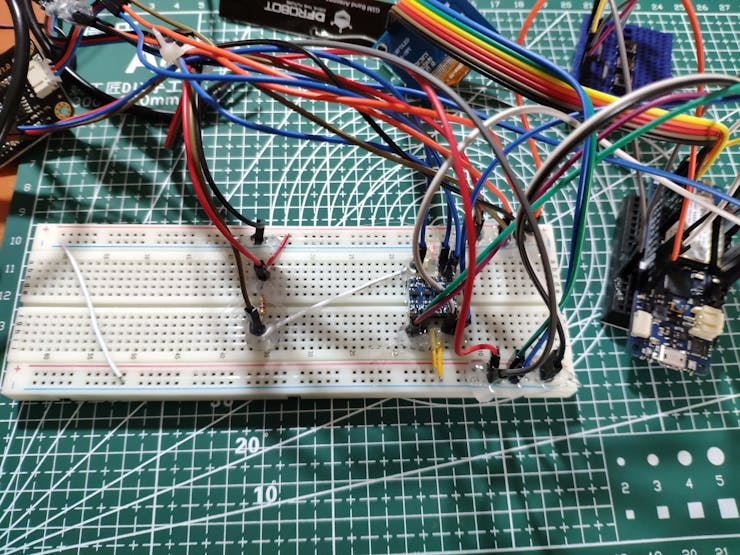
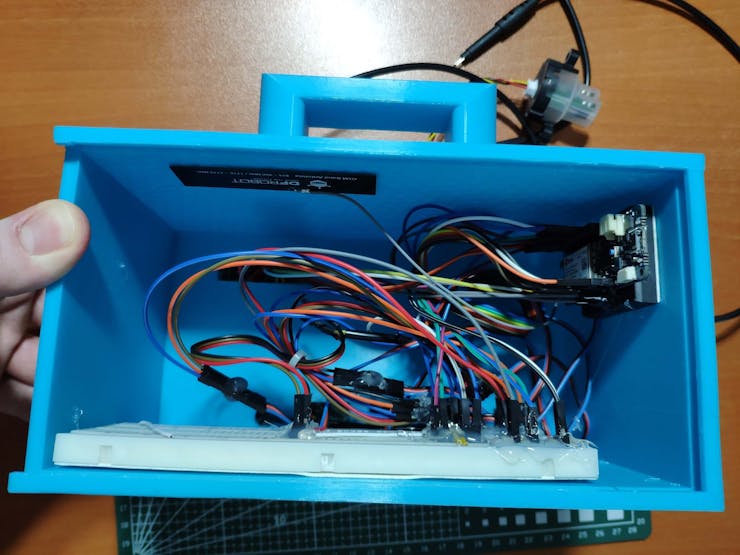
After completing sensor connections and adjustments on breadboards successfully, I made the breadboard connection points rigid by utilizing a hot glue gun.
After completing sensor connections and adjustments on breadboards successfully, I made the breadboard connection points rigid by utilizing a hot glue gun.
Then, after printing all 3D parts (models), I fastened all components to the main case.
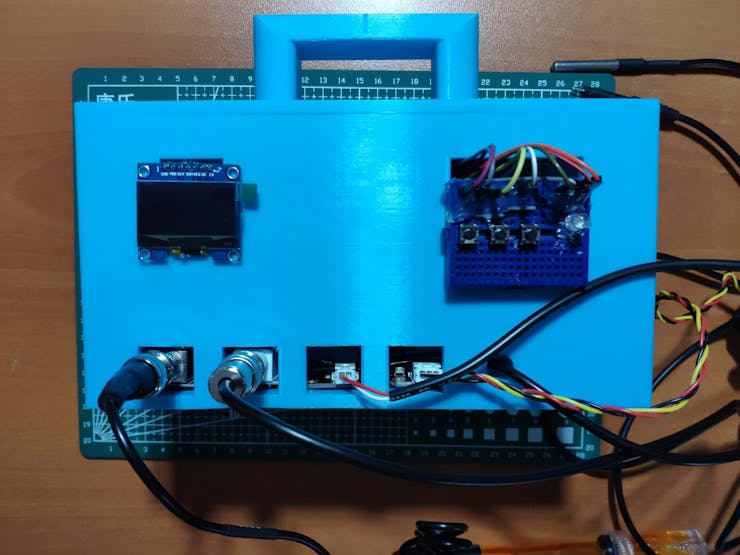
Finally, I inserted the sliding cover in its slot on the main case and affixed the Squirtle and the dolphin figure to the top via the hot glue gun.
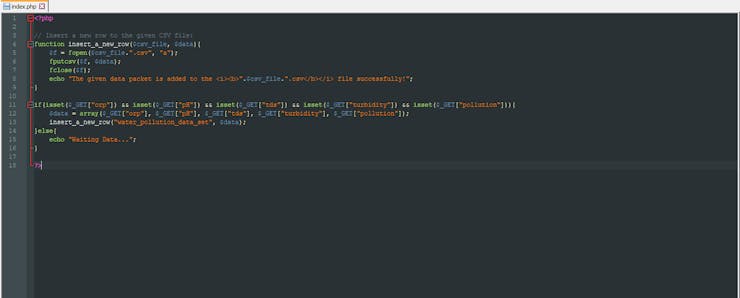
To be able to log and analyze water quality data transmitted over GPRS by the MKR GSM 1400, I decided to develop a web application in PHP named water_pollution_data_logger.
As shown below, the web application consists of two files:
⭐ In the insert_a_new_row function, append a new row to the given CSV file by utilizing the fputcsv function.
function insert_a_new_row($csv_file, $data){
	$f = fopen($csv_file.".csv", "a");
	fputcsv($f, $data);
	fclose($f);
	echo "The given data packet is added to the <i><b>".$csv_file.".csv</b></i> file successfully!";
}
⭐ If all required data fields are received from the MKR GSM 1400, save them as a new row to the given CSV file:
if(isset($_GET["orp"]) && isset($_GET["pH"]) && isset($_GET["tds"]) && isset($_GET["turbidity"]) && isset($_GET["pollution"])){
	$data = array($_GET["orp"], $_GET["pH"], $_GET["tds"], $_GET["turbidity"], $_GET["pollution"]);
	insert_a_new_row("water_pollution_data_set", $data);
}else{
	echo "Waiting Data...";
}
After creating my web application in PHP, I decided to test it on an Apache server hosted on my Raspberry Pi 4. Nonetheless, the MKR GSM 1400 cannot connect to a Raspberry Pi server over GPRS without applying port forwarding. Therefore, I utilized my website (theamplituhedron.com) to host and run this web application after testing its features on Raspberry Pi.
If you want to use Raspberry Pi to test this web application, as did I, but you do not know how to set up a LAMP web server on Raspberry Pi, you can inspect my previous tutorial.
#️⃣ First of all, install the water_pollution_data_logger application.
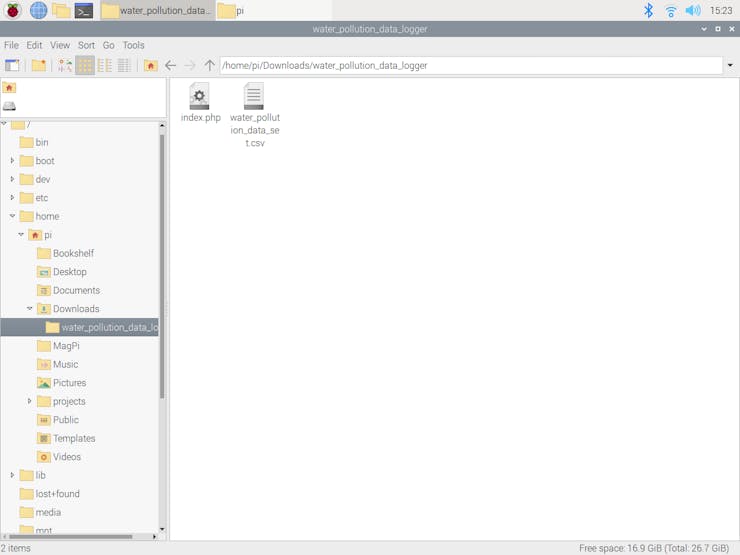
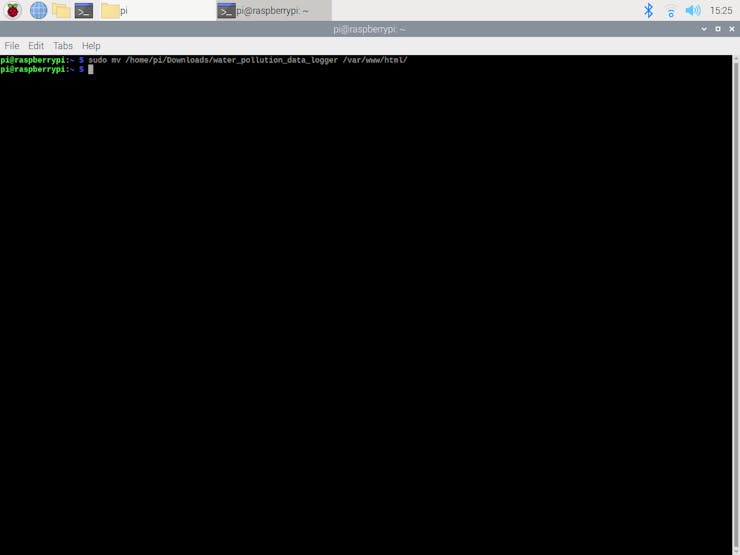
#️⃣ Then, move the application folder (water_pollution_data_logger) to the Apache server (/var/www/html) by using the terminal since the Apache server is a protected location.
sudo mv /home/pi/Downloads/water_pollution_data_logger /var/www/html/
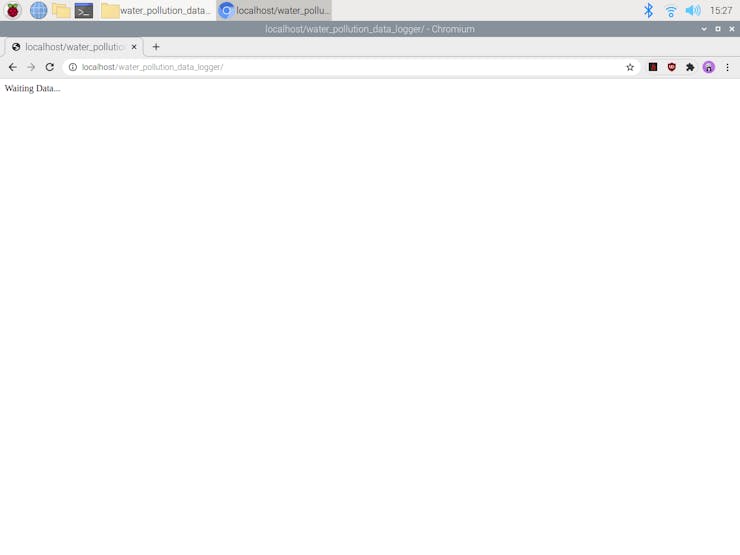
#️⃣ If the required parameters are not set, the web application prints: Waiting Data...
localhost/water_pollution_data_logger/
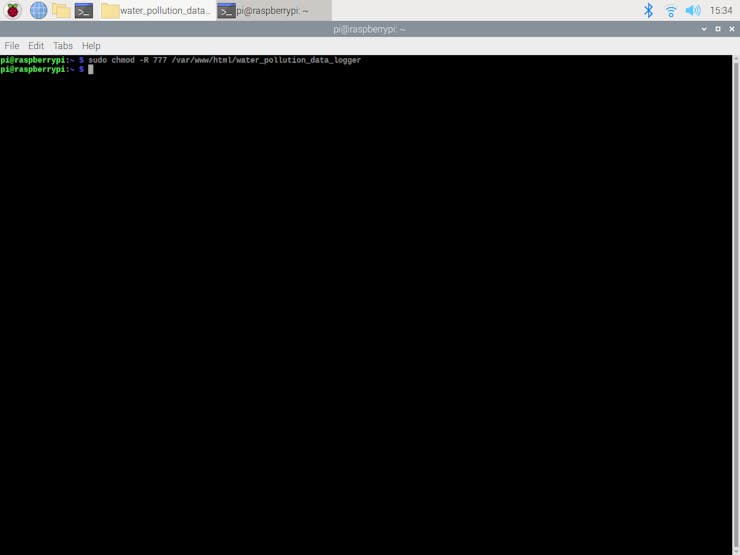
#️⃣ Since the Apache server is a protected location, it throws an error while attempting to modify the files and folders in it. Therefore, before utilizing the web application to insert data elements into the given CSV file, change the web application's folder permission by using the terminal:
sudo chmod -R 777 /var/www/html/water_pollution_data_logger
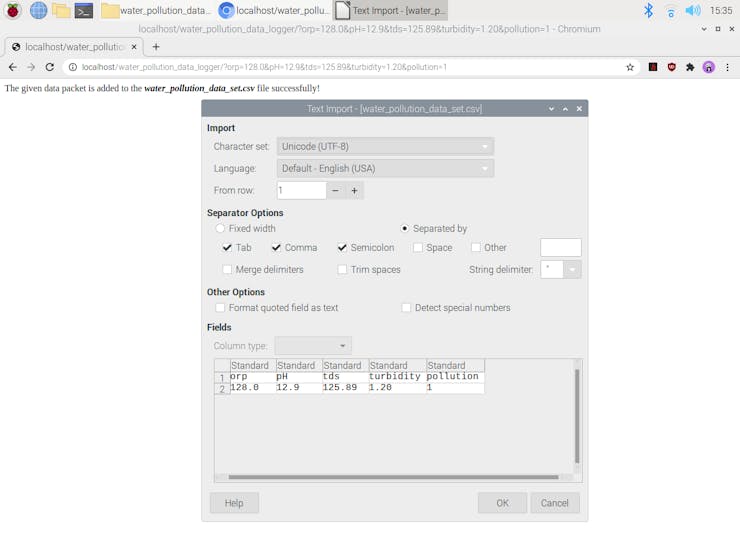
#️⃣ If the required parameters are received, the web application processes them as an array and appends the data array to the given CSV file as a new row.
localhost/water_pollution_data_logger/?orp=<_data_>&pH=<_data_>&tds=<_data_>&turbidity=<_data_>&pollution=<_class_>
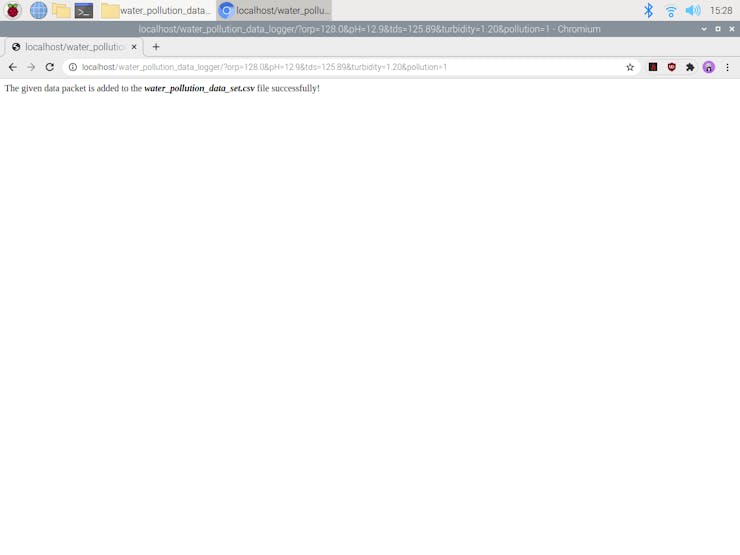
#️⃣ Then, if the given data array is inserted successfully, the application prints:
The given data packet is added to the <_>.csv file successfully!
Since the Arduino MKR GSM 1400 can transfer data packets over GPRS, I decided to develop a web application so as to obtain the transmitted data packets and log the collected water quality data in the field without applying any additional procedures, as discussed in the previous step. Also, I employed the MKR GSM 1400 to send the prediction (detection) result via SMS to a given mobile number after running my neural network model.
To enable the GSM modem features, I attached a DFRobot GSM antenna tuned for the frequency band in use in the GSM / 3G range to the MKR GSM 1400.
Before proceeding with the following steps, I needed to set up the MKR GSM 1400 on the Arduino IDE and install the required libraries for this project.
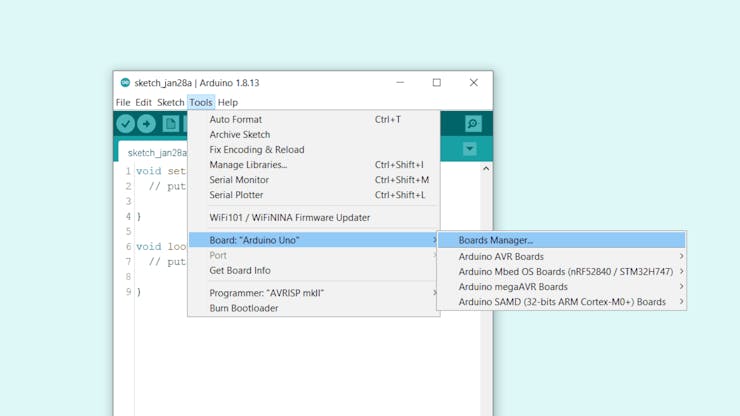
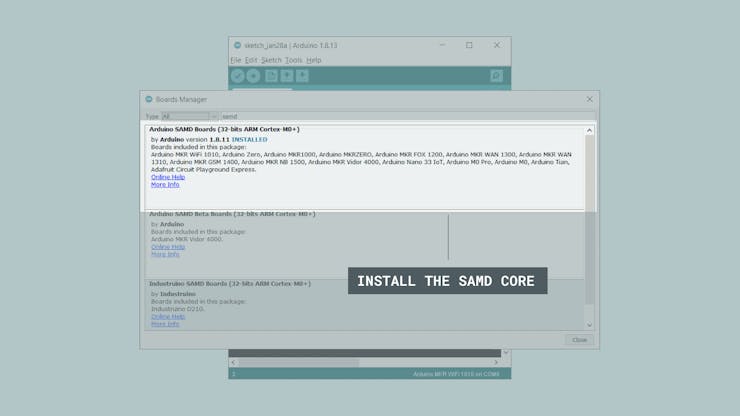
#️⃣ To install the required core, navigate to Tools ➡ Board ➡ Boards Manager and search for Arduino SAMD Boards.
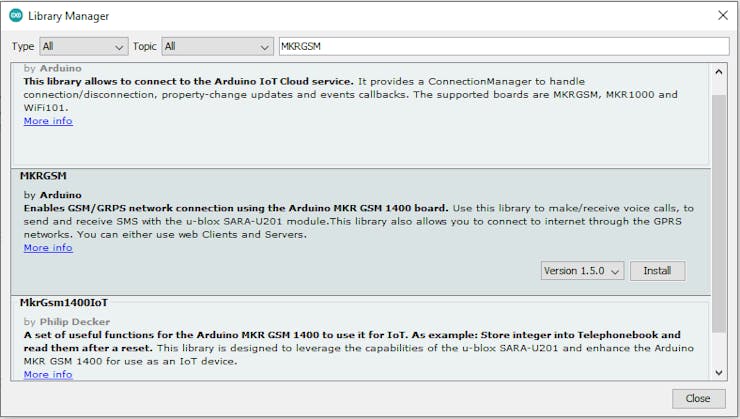
#️⃣ To make voice calls, send SMS messages, and connect to a website over GPRS via a data-enabled SIM card, download the MKRGSM library: Go to Sketch ➡ Include Library ➡ Manage Libraries… and search for MKRGSM.
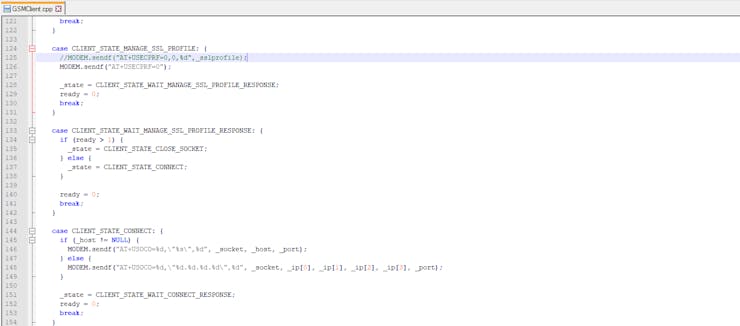
Since I employed my website (theamplituhedron.com) to host my web application to log the transferred data packets easily, I needed to make an HTTPS GET request to send information over GPRS. However, the MKRGSM library throws an error message while attempting to establish SSL connections with some websites, including mine. Therefore, I needed to disable the certificate validation in the GSMClient.cpp file.
#️⃣ To disable the certificate validation, navigate to \MKRGSM\src\GSMClient.cpp and modify these lines as shown below.
//MODEM.sendf("AT+USECPRF=0,0,%d",_sslprofile);
MODEM.sendf("AT+USECPRF=0");
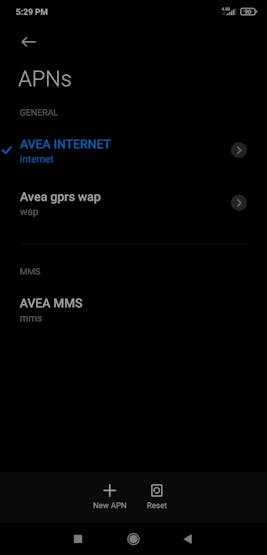
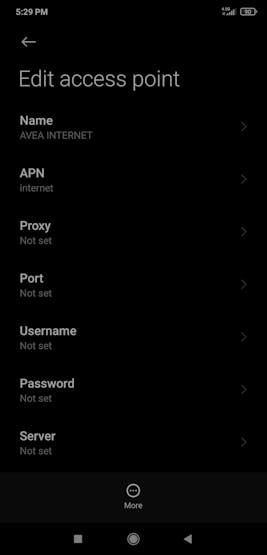
Since the MKRGSM library requires the Access Point Name (APN) of the data-enabled SIM card to connect to the GPRS network, I needed to find the APN information of my service provider.
You can find the APN information of your service provider from here or in the Settings app on your mobile phone, as did I.
#️⃣ Finally, download the required libraries for the DS18B20 waterproof temperature sensor and the SH1106 OLED display:
OneWire | Download
DallasTemperature | Download
Adafruit_SH110x | Download
Adafruit-GFX-Library | Download
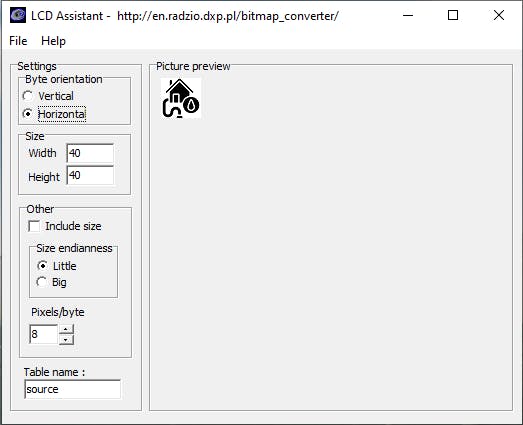
To display images (black and white) on the SH1106 OLED screen successfully, I needed to create monochromatic bitmaps from PNG or JPG files and convert those bitmaps to data arrays.
#️⃣ First of all, download the LCD Assistant.
#️⃣ Then, upload a monochromatic bitmap and select Vertical or Horizontal depending on the screen type.
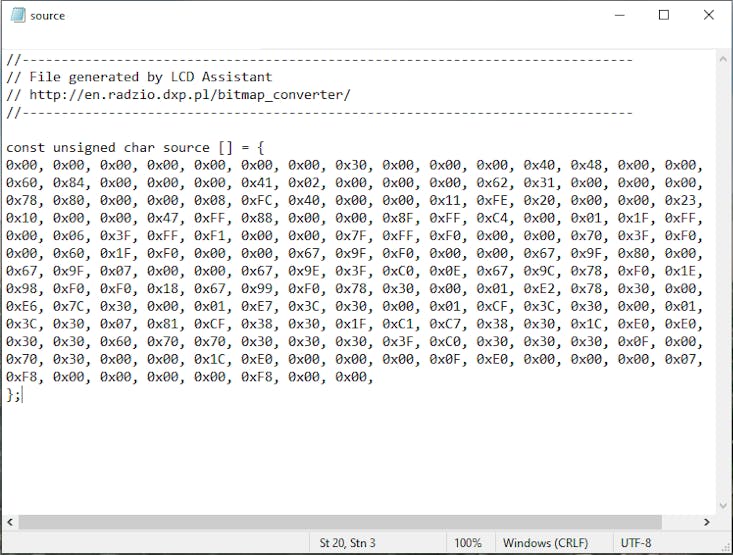
#️⃣ Convert the image (bitmap) and save the output (data array).
#️⃣ Finally, add the data array to the code and print it on the screen.
const unsigned char source [] = {
0x00, 0x00, 0x00, 0x00, 0x00, 0x00, 0x00, 0x30, 0x00, 0x00, 0x00, 0x40, 0x48, 0x00, 0x00, 0x00,
0x60, 0x84, 0x00, 0x00, 0x00, 0x41, 0x02, 0x00, 0x00, 0x00, 0x62, 0x31, 0x00, 0x00, 0x00, 0x44,
0x78, 0x80, 0x00, 0x00, 0x08, 0xFC, 0x40, 0x00, 0x00, 0x11, 0xFE, 0x20, 0x00, 0x00, 0x23, 0xFF,
0x10, 0x00, 0x00, 0x47, 0xFF, 0x88, 0x00, 0x00, 0x8F, 0xFF, 0xC4, 0x00, 0x01, 0x1F, 0xFF, 0xE2,
0x00, 0x06, 0x3F, 0xFF, 0xF1, 0x00, 0x00, 0x7F, 0xFF, 0xF0, 0x00, 0x00, 0x70, 0x3F, 0xF0, 0x00,
0x00, 0x60, 0x1F, 0xF0, 0x00, 0x00, 0x67, 0x9F, 0xF0, 0x00, 0x00, 0x67, 0x9F, 0x80, 0x00, 0x00,
0x67, 0x9F, 0x07, 0x00, 0x00, 0x67, 0x9E, 0x3F, 0xC0, 0x0E, 0x67, 0x9C, 0x78, 0xF0, 0x1E, 0x67,
0x98, 0xF0, 0xF0, 0x18, 0x67, 0x99, 0xF0, 0x78, 0x30, 0x00, 0x01, 0xE2, 0x78, 0x30, 0x00, 0x01,
0xE6, 0x7C, 0x30, 0x00, 0x01, 0xE7, 0x3C, 0x30, 0x00, 0x01, 0xCF, 0x3C, 0x30, 0x00, 0x01, 0xCF,
0x3C, 0x30, 0x07, 0x81, 0xCF, 0x38, 0x30, 0x1F, 0xC1, 0xC7, 0x38, 0x30, 0x1C, 0xE0, 0xE0, 0x30,
0x30, 0x30, 0x60, 0x70, 0x70, 0x30, 0x30, 0x30, 0x3F, 0xC0, 0x30, 0x30, 0x30, 0x0F, 0x00, 0x38,
0x70, 0x30, 0x00, 0x00, 0x1C, 0xE0, 0x00, 0x00, 0x00, 0x0F, 0xE0, 0x00, 0x00, 0x00, 0x07, 0x80,
0xF8, 0x00, 0x00, 0x00, 0x00, 0xF8, 0x00, 0x00,
};

...

display.clearDisplay();
display.drawBitmap((SCREEN_WIDTH/2)-(40/2), 0, source, 40, 40, SH110X_WHITE);
display.display();
After setting up the MKR GSM 1400 and installing the required libraries and modules, I programmed the MKR GSM 1400 to collect ORP, pH, TDS, and turbidity measurements in order to transfer them to the PHP web application over GPRS.
Since I needed to assign water pollution levels (classes) experimentally as labels for each data record while collecting water quality data in the field to create a valid data set, I utilized the control buttons attached to the MKR GSM 1400 so as to choose among pollution classes. After selecting a water pollution class, the MKR GSM 1400 appends the selected class to the collected water quality data and then transmits the data packet to the web application over GPRS.
You can download the water_pollution_monitor_data_collect.ino file to try and inspect the code for collecting water quality data and transferring data packets to a given web application over GPRS.
⭐ Include the required libraries.
#include <MKRGSM.h>
#include <SPI.h>
#include <Wire.h>
#include <Adafruit_GFX.h>
#include <Adafruit_SH110X.h>
#include <OneWire.h>
#include <DallasTemperature.h>
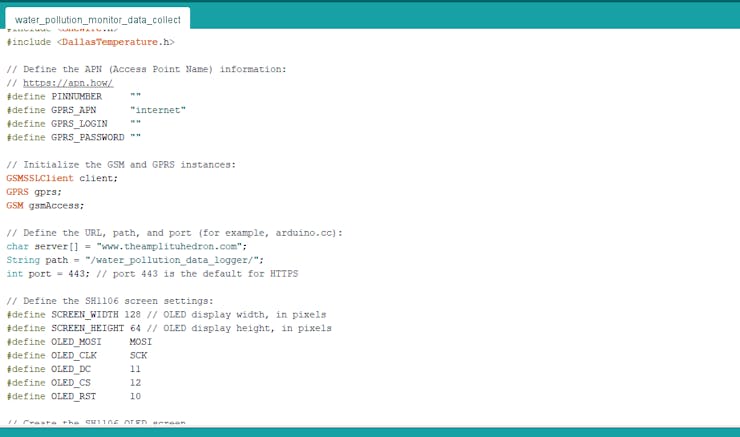
⭐ Define the APN (Access Point Name) information.
⭐ Initialize the GSM and GPRS instances.
#define PINNUMBER     ""
#define GPRS_APN      "internet"
#define GPRS_LOGIN    ""
#define GPRS_PASSWORD ""

// Initialize the GSM and GPRS instances:
GSMSSLClient client;
GPRS gprs;
GSM gsmAccess;
⭐ Define the SH1106 screen settings.
#define SCREEN_WIDTH 128 // OLED display width, in pixels
#define SCREEN_HEIGHT 64 // OLED display height, in pixels
#define OLED_MOSI     MOSI
#define OLED_CLK      SCK
#define OLED_DC       11
#define OLED_CS       12
#define OLED_RST      10

// Create the SH1106 OLED screen.
Adafruit_SH1106G display = Adafruit_SH1106G(SCREEN_WIDTH, SCREEN_HEIGHT, OLED_MOSI, OLED_CLK, OLED_DC, OLED_RST, OLED_CS);
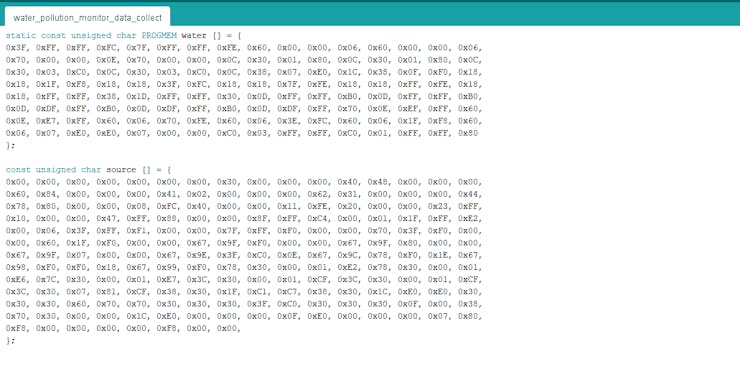
⭐ Define monochrome graphics.
⭐ Define water quality sensor settings.
⭐ Define the DS18B20 waterproof temperature sensor settings.
#define ONE_WIRE_BUS 1
OneWire oneWire(ONE_WIRE_BUS);
DallasTemperature DS18B20(&oneWire);
⭐ Initialize the DS18B20 temperature sensor.
⭐ Initialize the SH1106 OLED screen.
DS18B20.begin();

  // Initialize the SH1106 screen:
  display.begin(0, true);
  display.display();
  delay(1000);
⭐ In the err_msg function, display the error message on the SH1106 OLED screen and blink_ the RGB LED as red.
void err_msg(){
  // Show the error message on the SH1106 screen.
  display.clearDisplay();
  display.drawBitmap(48, 0, _error, 32, 32, SH110X_WHITE);
  display.setTextSize(1);
  display.setTextColor(SH110X_WHITE);
  display.setCursor(0,40);
  display.println("Check the serial monitor to see the error!");
  display.display();
  adjustColor(255,0,0);
  delay(1000);
  display.invertDisplay(true);
  delay(1000);
  display.invertDisplay(false);
  delay(1000);
  adjustColor(0,0,0);
}
⭐ Start the GSM modem and attach the MKR GSM 1400 to the GPRS network with the APN, login, and password variables.
bool connected = false;
  // Uncomment to debug errors with AT commands.
  //MODEM.debug();
  while(!connected){
    if((gsmAccess.begin(PINNUMBER) == GSM_READY) && (gprs.attachGPRS(GPRS_APN, GPRS_LOGIN, GPRS_PASSWORD) == GPRS_READY)){
      connected = true;
    }else{
      Serial.println("GSM Modem: Not connected!\n");
      err_msg();
      delay(1000);
    }
  }
⭐ Update the timers.
read_timer = millis(); data_timer = millis();
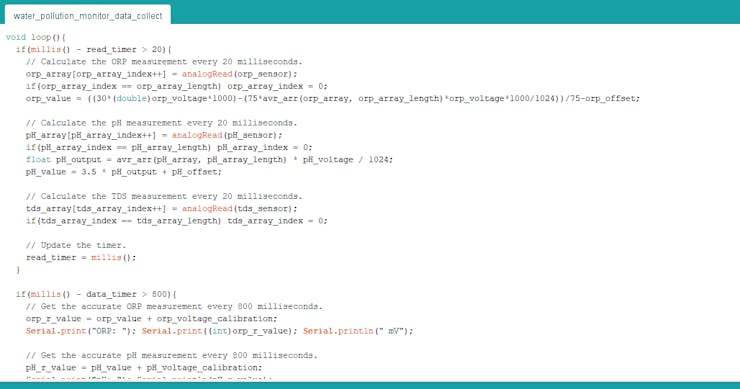
⭐ Every 20 milliseconds:
⭐ Calculate the oxidation-reduction potential (ORP) measurement.
⭐ Calculate the pH measurement.
⭐ Calculate the total dissolved solids (TDS) measurement.
⭐ Update the timer (read_timer).
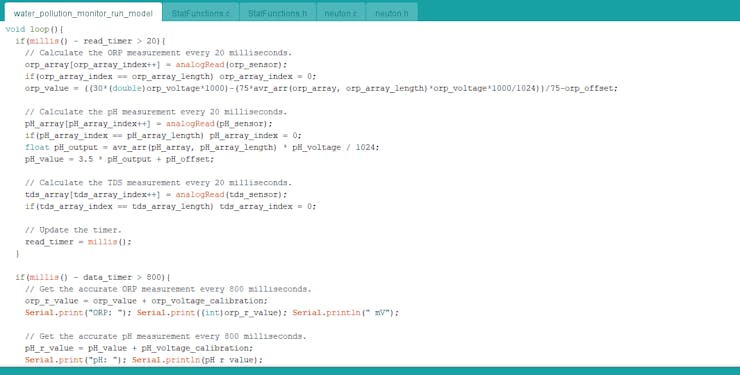
if(millis() - read_timer > 20){
    // Calculate the ORP measurement every 20 milliseconds.
    orp_array[orp_array_index++] = analogRead(orp_sensor);
    if(orp_array_index == orp_array_length) orp_array_index = 0;
    orp_value = ((30*(double)orp_voltage*1000)-(75*avr_arr(orp_array, orp_array_length)*orp_voltage*1000/1024))/75-orp_offset;

    // Calculate the pH measurement every 20 milliseconds.
    pH_array[pH_array_index++] = analogRead(pH_sensor);
    if(pH_array_index == pH_array_length) pH_array_index = 0;
    float pH_output = avr_arr(pH_array, pH_array_length) * pH_voltage / 1024;
    pH_value = 3.5 * pH_output + pH_offset;

    // Calculate the TDS measurement every 20 milliseconds.
    tds_array[tds_array_index++] = analogRead(tds_sensor);
    if(tds_array_index == tds_array_length) tds_array_index = 0;

    // Update the timer.
    read_timer = millis();
  }
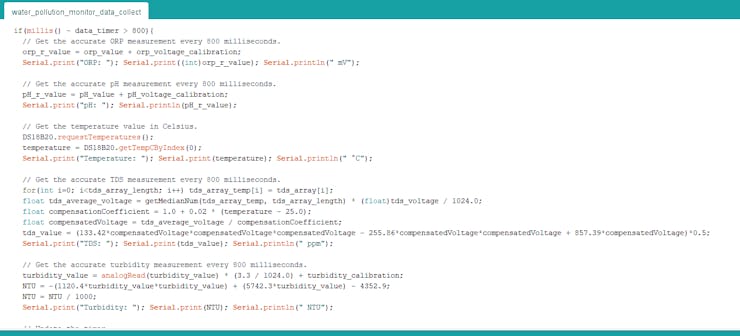
⭐ Every 800 milliseconds:
⭐ Obtain the accurate (calibrated) ORP measurement.
⭐ Obtain the accurate (calibrated) pH measurement.
⭐ Get the temperature value generated by the DS18B20 sensor in Celsius.
⭐ Obtain the accurate (calibrated) TDS measurement by compensating temperature.
⭐ Derive turbidity measurements in the NTU unit from the voltage signal (V) generated by the turbidity sensor.
⭐ Update the timer (data_timer).
if(millis() - data_timer > 800){
// Get the accurate ORP measurement every 800 milliseconds.
orp_r_value = orp_value + orp_voltage_calibration;
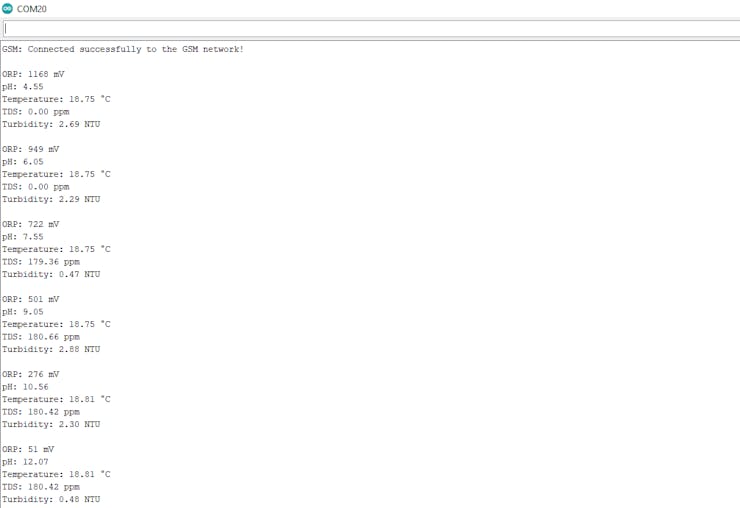
Serial.print("ORP: "); Serial.print((int)orp_r_value); Serial.println(" mV");
// Get the accurate pH measurement every 800 milliseconds.
pH_r_value = pH_value + pH_voltage_calibration;
Serial.print("pH: "); Serial.println(pH_r_value);
// Get the temperature value in Celsius.
DS18B20.requestTemperatures();
temperature = DS18B20.getTempCByIndex(0);
Serial.print("Temperature: "); Serial.print(temperature); Serial.println(" °C");
// Get the accurate TDS measurement every 800 milliseconds.
for(int i=0; i<tds_array_length; i++) tds_array_temp[i] = tds_array[i];
float tds_average_voltage = getMedianNum(tds_array_temp, tds_array_length) * (float)tds_voltage / 1024.0;
float compensationCoefficient = 1.0 + 0.02 * (temperature - 25.0);
float compensatedVoltage = tds_average_voltage / compensationCoefficient;
tds_value = (133.42*compensatedVoltage*compensatedVoltage*compensatedVoltage - 255.86*compensatedVoltage*compensatedVoltage + 857.39*compensatedVoltage)*0.5;
Serial.print("TDS: "); Serial.print(tds_value); Serial.println(" ppm");
// Get the accurate turbidity measurement every 800 milliseconds.
turbidity_value = analogRead(turbidity_value) * (3.3 / 1024.0) + turbidity_calibration;
NTU = -(1120.4*turbidity_value*turbidity_value) + (5742.3*turbidity_value) - 4352.9;
NTU = NTU / 1000;
Serial.print("Turbidity: "); Serial.print(NTU); Serial.println(" NTU");
// Update the timer.
data_timer = millis();
Serial.println("");
}
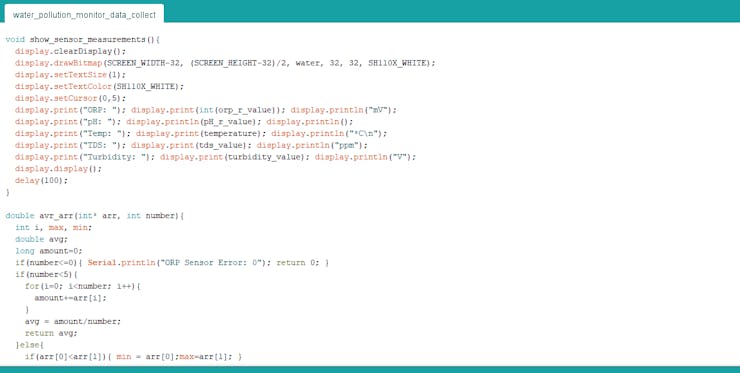
⭐ In the show_sensor_measurements function, display the collected water quality data on the SH1106 OLED screen:
void show_sensor_measurements(){
  display.clearDisplay();
  display.drawBitmap(SCREEN_WIDTH-32, (SCREEN_HEIGHT-32)/2, water, 32, 32, SH110X_WHITE);
  display.setTextSize(1);
  display.setTextColor(SH110X_WHITE);
  display.setCursor(0,5);
  display.print("ORP: "); display.print(int(orp_r_value)); display.println("mV");
  display.print("pH: "); display.println(pH_r_value); display.println();
  display.print("Temp: "); display.print(temperature); display.println("*C\n");
  display.print("TDS: "); display.print(tds_value); display.println("ppm");
  display.print("Turbidity: "); display.print(turbidity_value); display.println("V");
  display.display();
  delay(100);
}
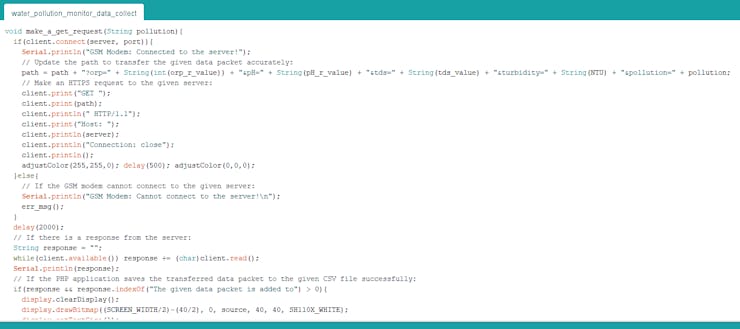
⭐ In the make_a_get_request function:
⭐ Connect to the given web server.
⭐ If the GSM modem connects to the server successfully, make an HTTPS GET request with the updated path over GPRS in order to transfer the data packet to the PHP web application. Then, blink_ the RGB LED as yellow.
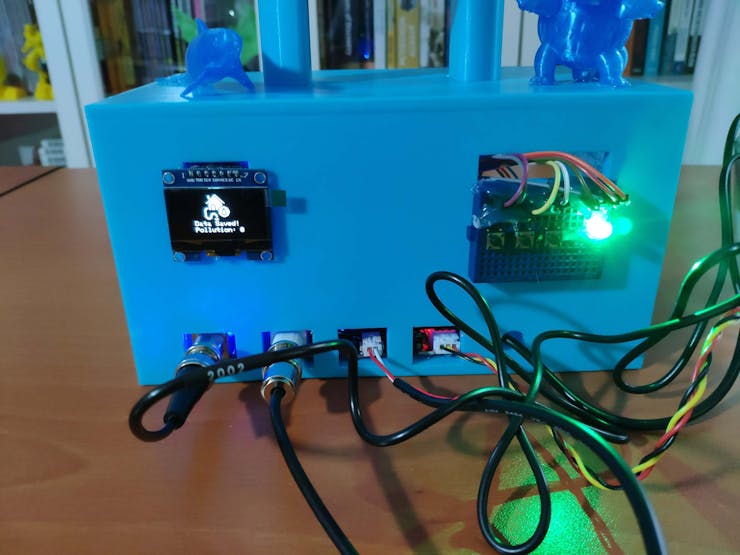
⭐ If there is a response from the server and the web application appends the transferred data packet to the given CSV file successfully, display the selected water pollution class on the SH1106 screen. Then, blink_ the RGB LED as green.
Data Saved!
Pollution: <_class_>
⭐ If the server is disconnected, stop the client.
void make_a_get_request(String pollution){
  if(client.connect(server, port)){
    Serial.println("GSM Modem: Connected to the server!");
    // Update the path to transfer the given data packet accurately:
    path = path + "?orp=" + String(int(orp_r_value)) + "&pH=" + String(pH_r_value) + "&tds=" + String(tds_value) + "&turbidity=" + String(NTU) + "&pollution=" + pollution;
    // Make an HTTPS request to the given server:
    client.print("GET ");
    client.print(path);
    client.println(" HTTP/1.1");
    client.print("Host: ");
    client.println(server);
    client.println("Connection: close");
    client.println();
    adjustColor(255,255,0); delay(500); adjustColor(0,0,0);
  }else{
    // If the GSM modem cannot connect to the given server:
    Serial.println("GSM Modem: Cannot connect to the server!\n");
    err_msg();
  }
  delay(2000);
  // If there is a response from the server:
  String response = "";
  while(client.available()) response += (char)client.read();
  Serial.println(response);
  // If the PHP application saves the transferred data packet to the given CSV file successfully:
  if(response && response.indexOf("The given data packet is added to") > 0){
    display.clearDisplay();
    display.drawBitmap((SCREEN_WIDTH/2)-(40/2), 0, source, 40, 40, SH110X_WHITE);
    display.setTextSize(1);
    display.setTextColor(SH110X_WHITE);
    display.setCursor(30,42);
    display.print("Data Saved!");
    display.setCursor(30,52);
    display.print("Pollution: "); display.print(pollution);
    display.display();
    adjustColor(0,255,0);
    delay(2000);
    display.invertDisplay(true);
    delay(2000);
    display.invertDisplay(false);
    delay(2000);
    adjustColor(0,0,0);
  }else{
    Serial.println("GSM Modem: No response from the server!\n");
    err_msg();
  }
  // If the server is disconnected, stop the client:
  if(!client.available() && !client.connected()){
    Serial.println("GSM Modem: Disconnecting from the server!\n");
    client.stop();
  }
}
⭐ According to the pressed control button (1, 2, or 3), transfer the data packet over GPRS to the given web application, including the selected water pollution class.
  if(!digitalRead(BUTTON_1)) make_a_get_request("0");
  if(!digitalRead(BUTTON_2)) make_a_get_request("1");
  if(!digitalRead(BUTTON_3)) make_a_get_request("2");
After uploading and running the code for collecting water quality data and transmitting data packets to a given web application over GPRS on the MKR GSM 1400:
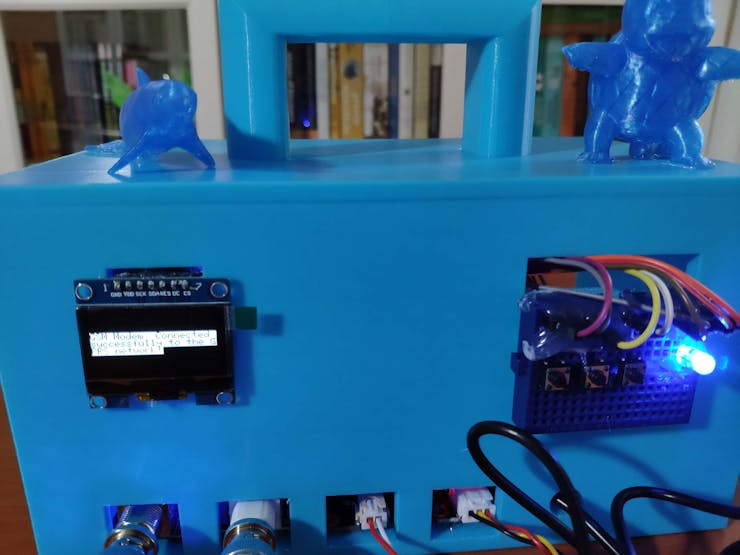
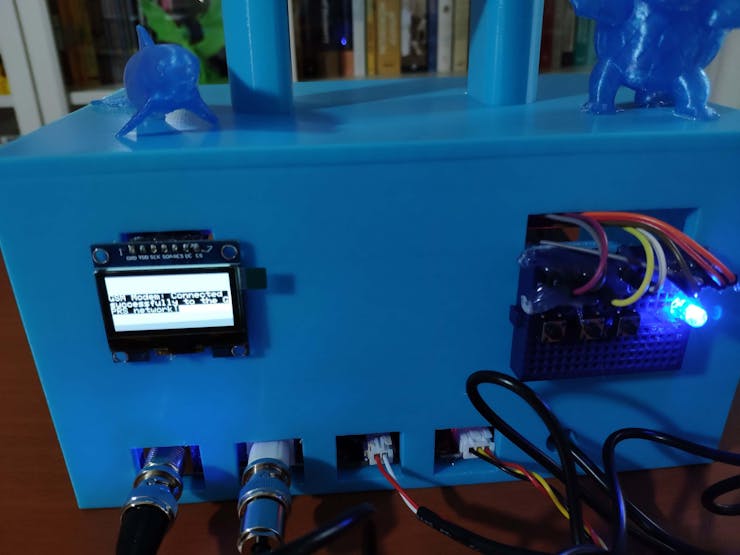
🌊🚱 The device waits for the GSM modem to connect to the GPRS network.
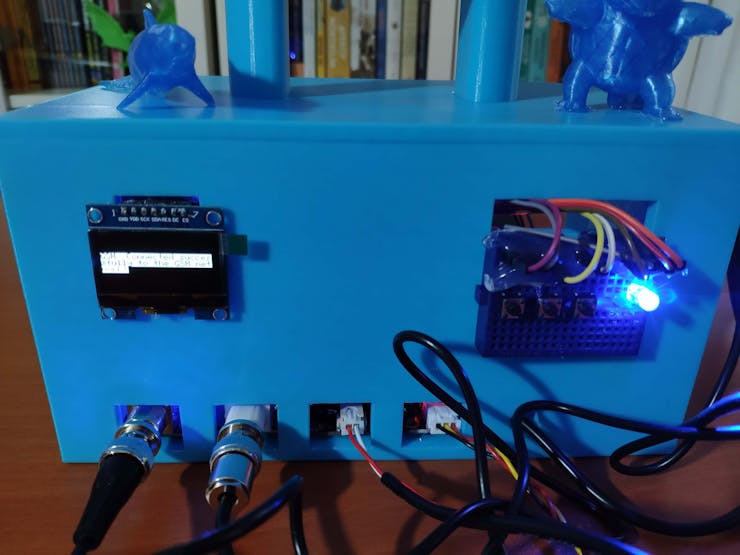
🌊🚱 If the GSM modem connects to the GPRS network successfully, the device turns the RGB LED to blue and prints (also inverts) this message on the screen:
GSM Modem: Connected successfully to the GPRS network!
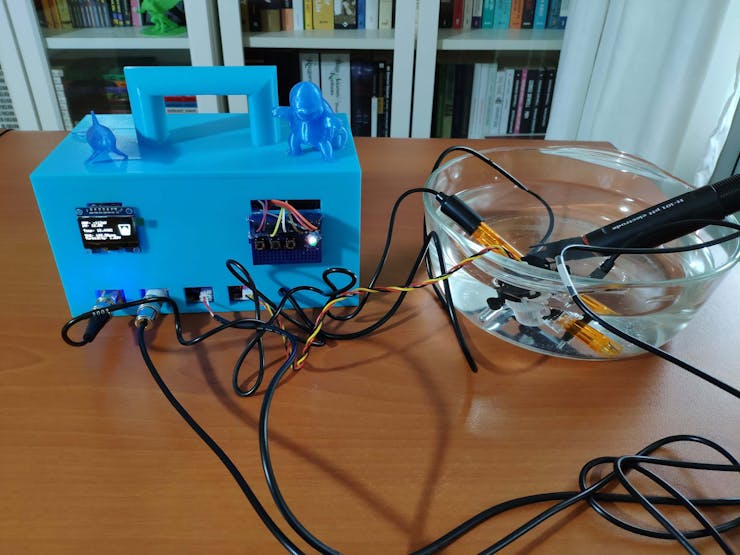
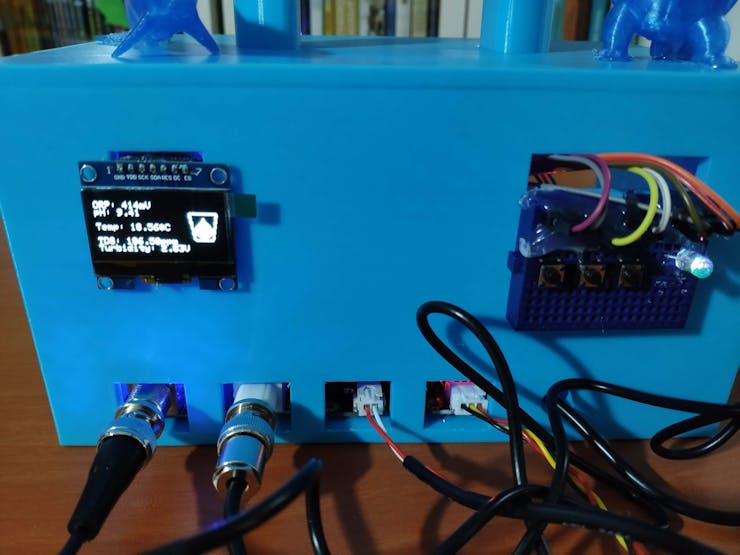
🌊🚱 After soaking water quality sensors in a sample from a water resource, the device displays the collected water quality data of that sample on the screen:
🌊🚱 After pressing one of the control buttons (1, 2, or 3), the device blink_s the RGB LED as yellow if the GSM modem connects to the given web server over GPRS successfully.
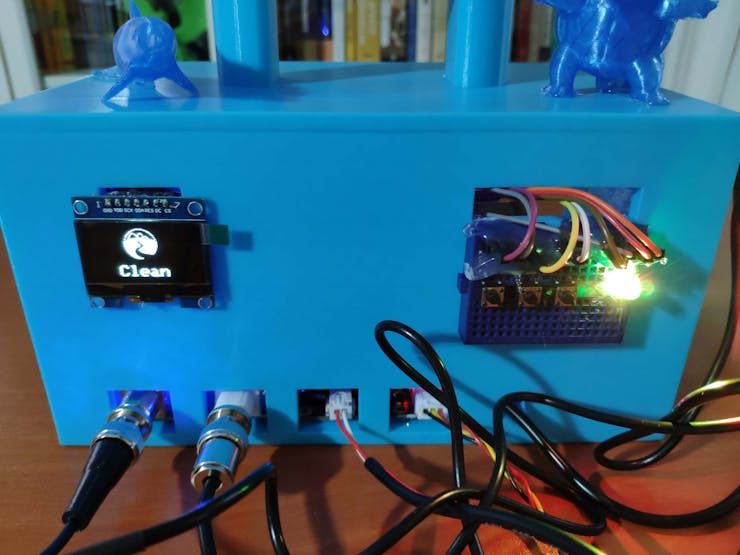
🌊🚱 If the control button (1) is pressed, the device transmits the data packet by adding the Clean [0] pollution class to the given PHP web application. Then, if the web application appends the transferred data packet to the given CSV file successfully, the device displays (also inverts) the various water resources, I elicited my data set with eminent validity :)
When I completed collating my water pollution data set and assigning labels, I had started to work on my artificial neural network model (ANN) to make predictions on water pollution levels (classes) based on ORP, pH, TDS, and turbidity measurements.
Since the Arduino MKR GSM 1400 is not generally preferred to run neural network models, most platforms and official TinyML libraries do not support it. Nonetheless, the Neuton TinyML platform supports almost every microcontroller (8, 16, and 32-bit) due to its unique neural network framework. Therefore, I decided to utilize Neuton to build my artificial neural network model.
As explained in the previous steps, I assigned water pollution classes for each data record experimentally while logging data in the field with the device. Since the assigned classes are stored under the pollution data field in the water_pollution_data_set.csv file, I did not need to preprocess my data set for labels before uploading it to Neuton.
Plausibly, Neuton allows building predictive models optimized in size and accuracy automatically in a single iteration without coding. Since Neuton does not reduce the model size by quantization, pruning, clustering, or distillation, it does not lessen the model accuracy for minimizing the model size. Thus, I was able to create an accurate neural network model to forecast water pollution levels effortlessly.
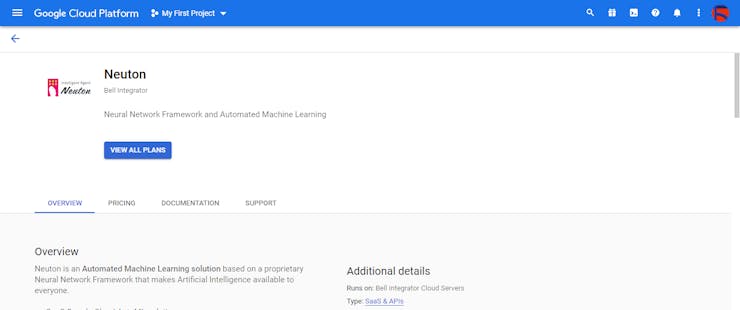
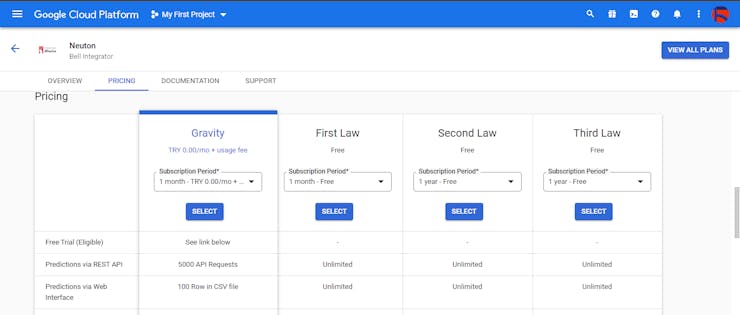
Since Neuton utilizes Google Cloud Platform infrastructure (cloud computing services) to train models, it requires a Google Cloud Platform (GCP) account with active billing to enable training models with unique data sets. After creating a GCP account, Google provides up to $300 credits to pay for infrastructure costs. Therefore, I could build and train my neural network model with my water pollution data set free of charge on Neuton.
#️⃣ After signing up for Neuton, subscribe and activate Neuton (Zero Gravity) on Google Cloud Platform (GCP) so as to enable training models with your data sets.


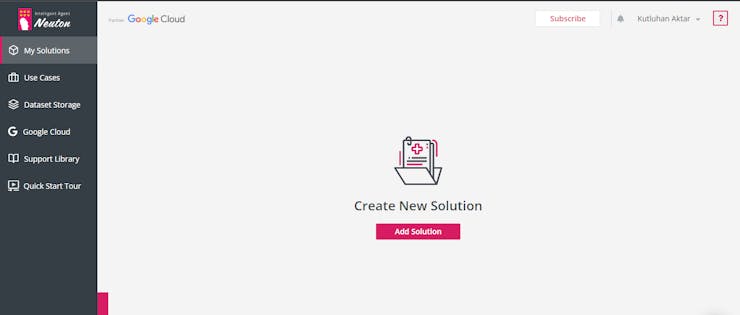
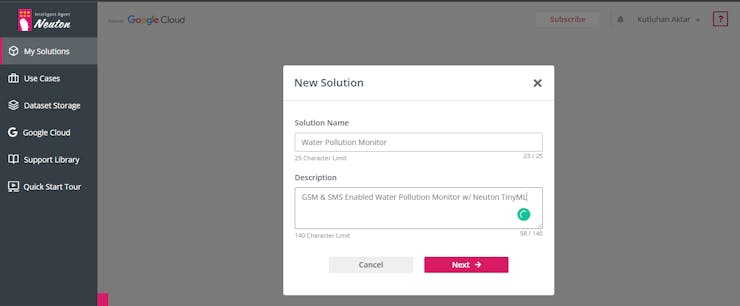
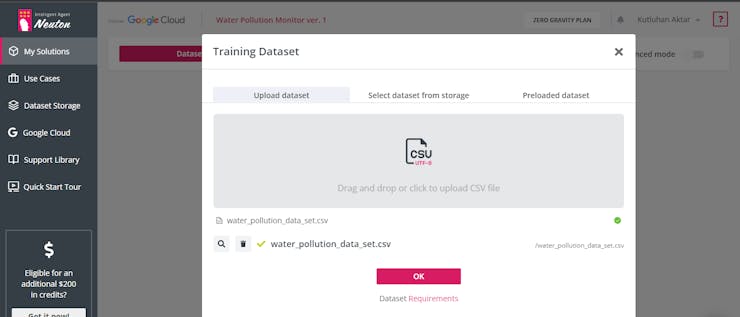
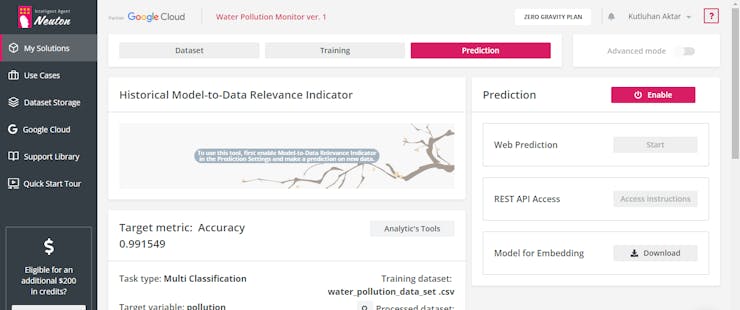
After activating Neuton (Zero Gravity) on my Google Cloud Platform (GCP) account, I created a new solution named Water Pollution Monitor and uploaded my water pollution data set (water_pollution_data_set.csv).
After completing logging water quality data from various water resources, my data set consisted of 40 rows (inputs) for each water pollution level (class), 120 rows in total.
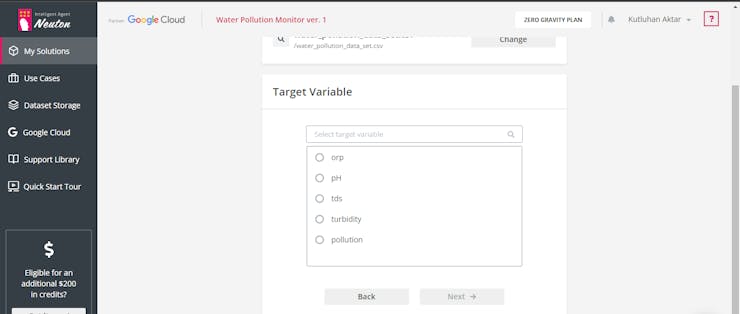
Then, I selected the target variable as pollution, which represents the data field for labels.
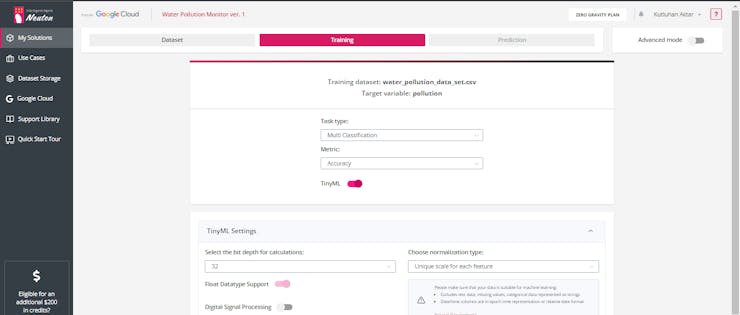
Since the MKR GSM 1400's main processor is a low-power Arm® Cortex®-M0 32-bit SAMD21, I selected the bit depth as 32.
Do not forget to activate TinyML and Float Datatype Support options to build an MKR GSM 1400-compatible model.
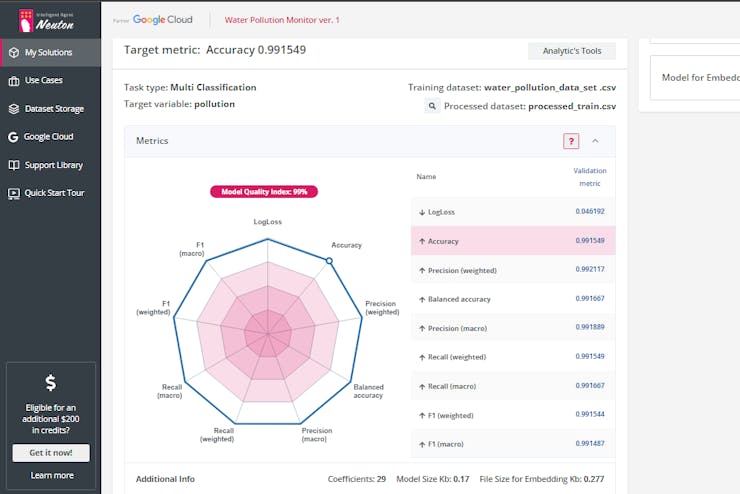
After utilizing my water pollution data set as the training set, Neuton built a neural network model automatically with the following characteristics:
Finally, I downloaded my neural network model (water_pollution_monitor_v1.zip) by navigating to Prediction ➡ Model for Embedding.
After building and training my neural network model with Neuton, I needed to upload and run my model directly on the MKR GSM 1400 so as to create an easy-to-use and capable device operating in the field without any dependencies.
Since Neuton models are ready and available for embedding to microcontrollers without any compression or optimization, I was able to import my model effortlessly to run inferences. Therefore, the MKR GSM 1400 can forecast water pollution levels without needing Internet connectivity.
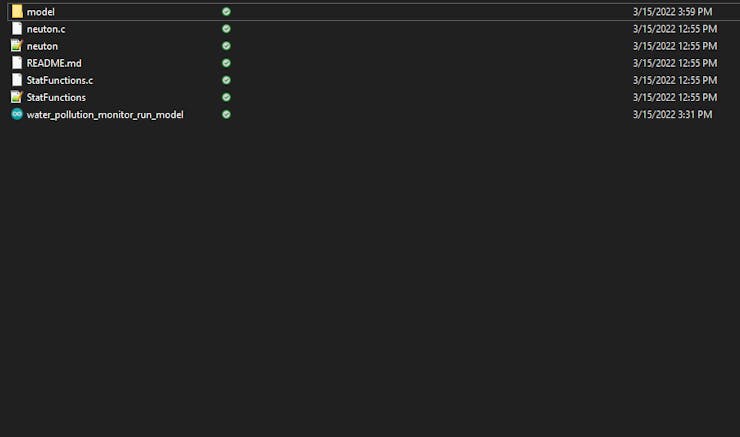
#️⃣ After installing the compressed Neuton model folder (water_pollution_monitor_v1.zip), copy all files in this archive to the Arduino IDE project folder.
#️⃣ Then, include the neuton.h file to import the Neuton neural network model.
#include "neuton.h"
After importing my model successfully to the Arduino IDE, I employed the control button (2) attached to the MKR GSM 1400 to run inferences so as to predict water pollution levels:
Press ➡ Run Inference
Also, after running inferences successfully, I utilized the MKR GSM 1400 to transmit the prediction (detection) result via SMS to a given mobile number.
You can download the water_pollution_monitor_run_model.ino file to try and inspect the code for running Neuton neural network models and sending SMS messages with the MKR GSM 1400.
You can inspect the corresponding functions and settings in Step 4.
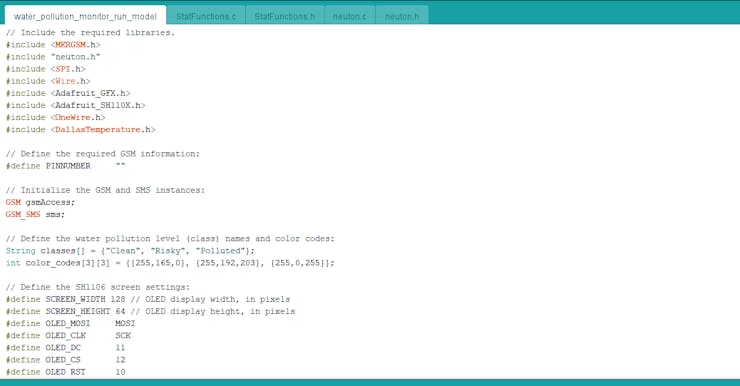
⭐ Include the required libraries.
#include <MKRGSM.h>
#include "neuton.h"
#include <SPI.h>
#include <Wire.h>
#include <Adafruit_GFX.h>
#include <Adafruit_SH110X.h>
#include <OneWire.h>
#include <DallasTemperature.h>
⭐ Define the required GSM information.
⭐ Initialize the GSM and SMS instances.
#define PINNUMBER     ""

// Initialize the GSM and SMS instances:
GSM gsmAccess;
GSM_SMS sms;
⭐ Define the water pollution level (class) names and color codes:
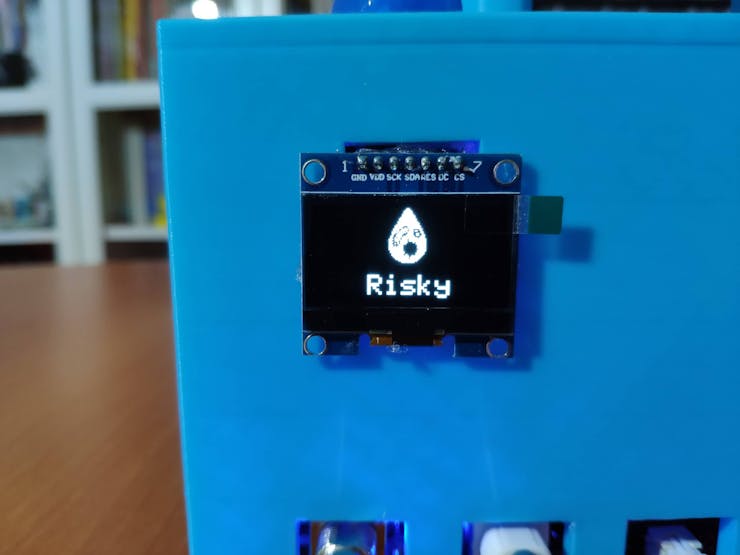
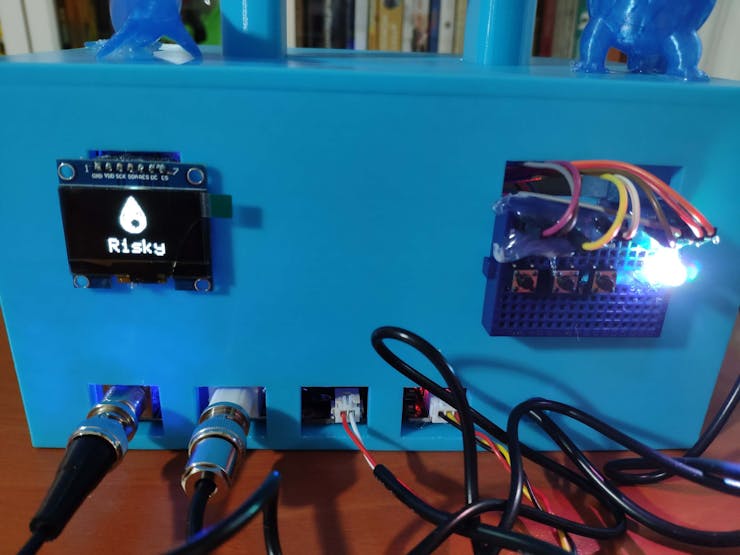
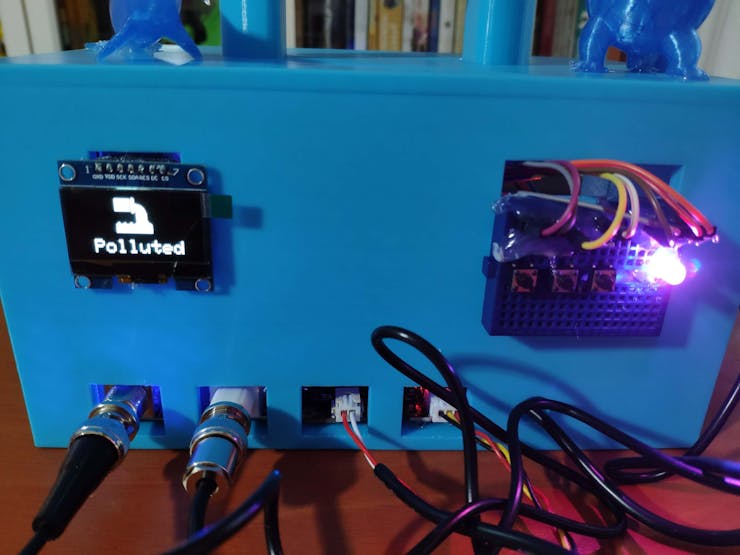
String classes[] = {"Clean", "Risky", "Polluted"};
int color_codes[3][3] = {{255,165,0}, {255,192,203}, {255,0,255}};
⭐ Define monochrome graphics.
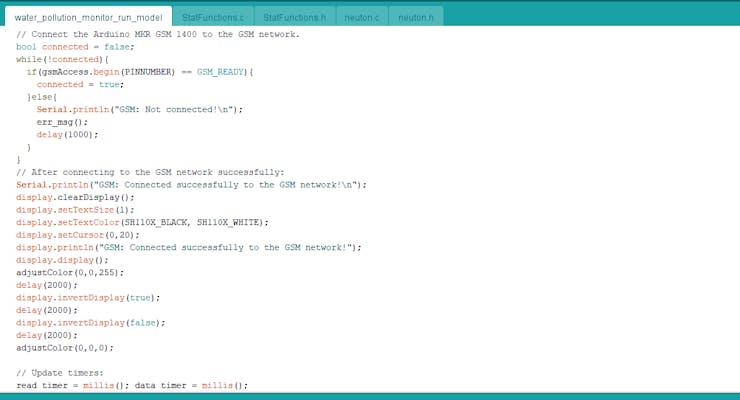
⭐ Connect the Arduino MKR GSM 1400 to the GSM network.
bool connected = false;
  while(!connected){
    if(gsmAccess.begin(PINNUMBER) == GSM_READY){
      connected = true;
    }else{
      Serial.println("GSM: Not connected!\n");
      err_msg();
      delay(1000);
    }
  }
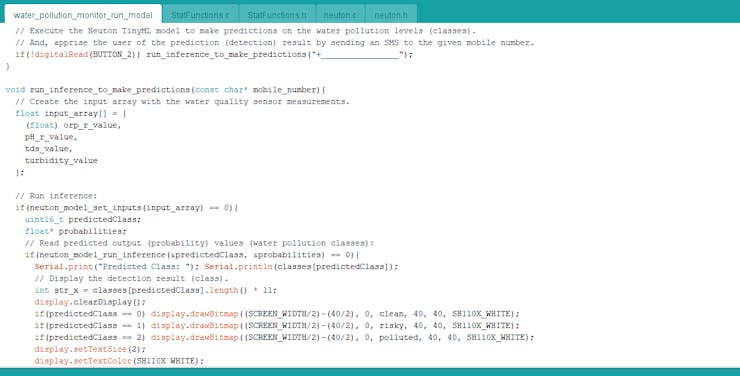
⭐ In the run_inference_to_make_predictions function:
⭐ Create the input array with the water quality sensor measurements.
⭐ Set the Neuton model inputs and then run inference.
⭐ Read predicted output (probability) values (water pollution classes).
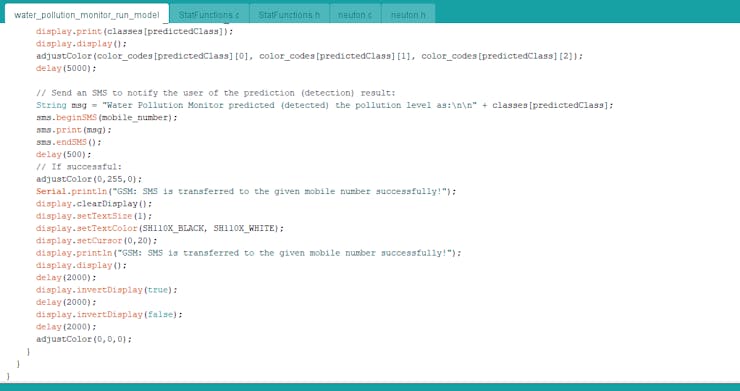
⭐ Display the prediction (detection) result (class) on the screen with its assigned monochrome icon and turn the RGB LED to its given color code.
⭐ Send an SMS message to the given mobile number in order to notify the user of the prediction (detection) result.
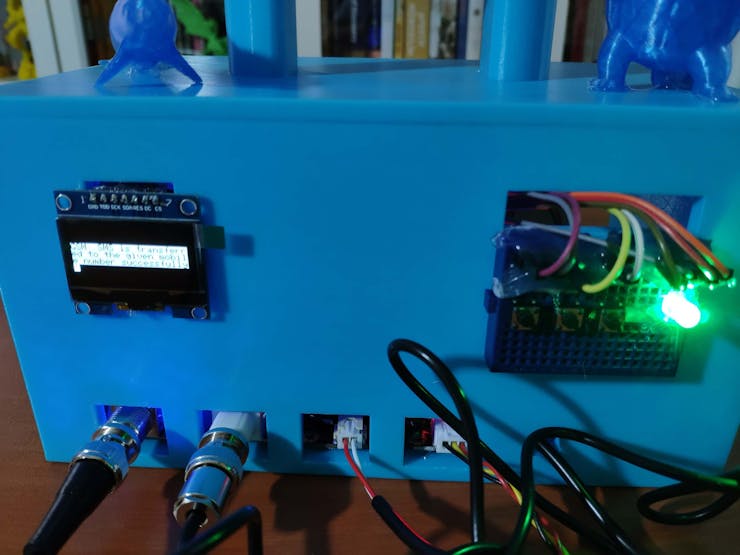
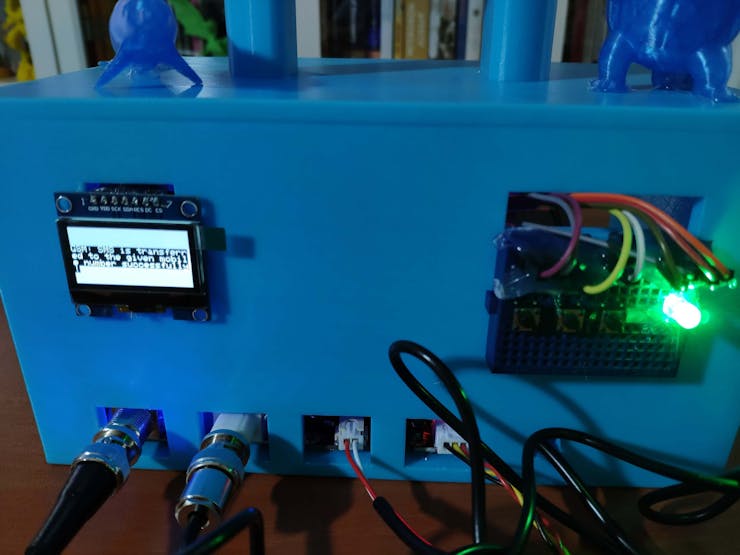
⭐ If the SMS message is transferred successfully, blink_ the RGB LED as green and print this message on the screen:
GSM: SMS is transferred to the given mobile number successfully!
void run_inference_to_make_predictions(const char* mobile_number){
// Create the input array with the water quality sensor measurements.
float input_array[] = {
(float) orp_r_value,
pH_r_value,
tds_value,
turbidity_value
};
// Run inference:
if(neuton_model_set_inputs(input_array) == 0){
uint16_t predictedClass;
float* probabilities;
// Read predicted output (probability) values (water pollution classes):
if(neuton_model_run_inference(&predictedClass, &probabilities) == 0){
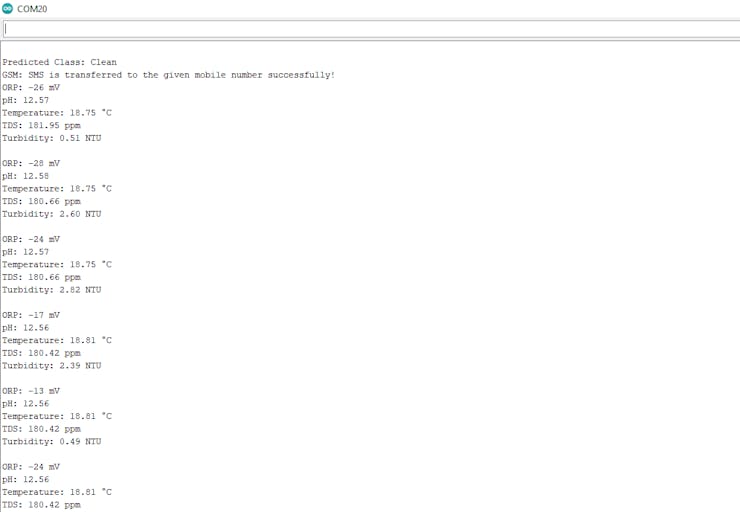
Serial.print("Predicted Class: "); Serial.println(classes[predictedClass]);
// Display the detection result (class).
int str_x = classes[predictedClass].length() * 11;
display.clearDisplay();
if(predictedClass == 0) display.drawBitmap((SCREEN_WIDTH/2)-(40/2), 0, clean, 40, 40, SH110X_WHITE);
if(predictedClass == 1) display.drawBitmap((SCREEN_WIDTH/2)-(40/2), 0, risky, 40, 40, SH110X_WHITE);
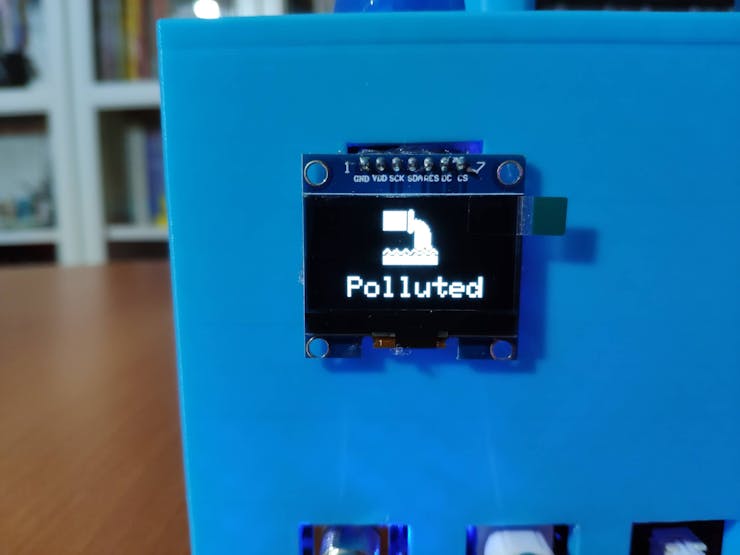
if(predictedClass == 2) display.drawBitmap((SCREEN_WIDTH/2)-(40/2), 0, polluted, 40, 40, SH110X_WHITE);
display.setTextSize(2);
display.setTextColor(SH110X_WHITE);
display.setCursor((SCREEN_WIDTH - str_x) / 2, 48);
display.print(classes[predictedClass]);
display.display();
adjustColor(color_codes[predictedClass][0], color_codes[predictedClass][1], color_codes[predictedClass][2]);
delay(5000);
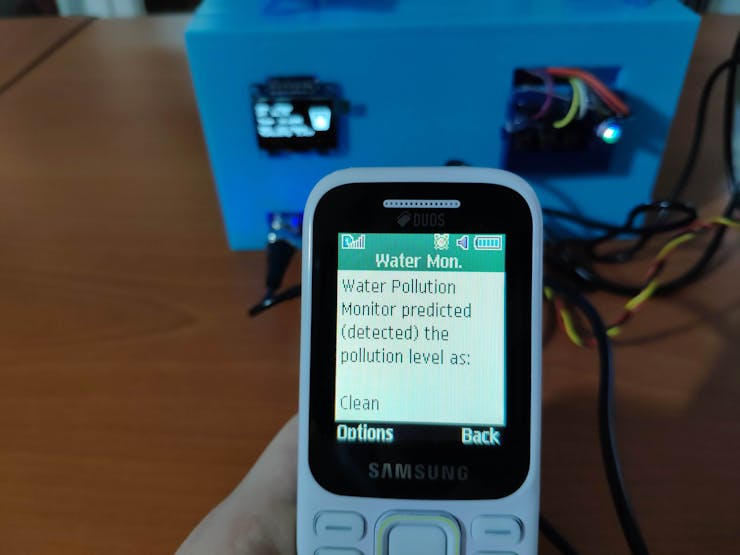
// Send an SMS to notify the user of the prediction (detection) result:
String msg = "Water Pollution Monitor predicted (detected) the pollution level as:\n\n" + classes[predictedClass];
sms.beginSMS(mobile_number);
sms.print(msg);
sms.endSMS();
delay(500);
// If successful:
adjustColor(0,255,0);
Serial.println("GSM: SMS is transferred to the given mobile number successfully!");
display.clearDisplay();
display.setTextSize(1);
display.setTextColor(SH110X_BLACK, SH110X_WHITE);
display.setCursor(0,20);
display.println("GSM: SMS is transferred to the given mobile number successfully!");
display.display();
delay(2000);
display.invertDisplay(true);
delay(2000);
display.invertDisplay(false);
delay(2000);
adjustColor(0,0,0);
}
}
}
⭐ If the control button (2) is pressed, run inference to forecast water pollution level and send an SMS message to the given mobile number so as to apprise the user of the prediction (detection) result.
if(!digitalRead(BUTTON_2)) run_inference_to_make_predictions("+________________");
My Neuton neural network model predicts possibilities of labels (water pollution classes) for each given input as an array of 3 numbers. They represent the model's "confidence" that the given input array corresponds to each of the three different water pollution classes based on ORP, pH, TDS, and turbidity measurements [0 - 2], as shown in Step 5:
After importing and setting up my neural network model on the MKR GSM 1400, I utilized the model to run inferences to forecast water pollution levels in the field.
As discussed in the previous steps, I also employed the MKR GSM 1400 to transmit the prediction (detection) result via SMS to a given mobile number.
After executing the water_pollution_monitor_run_model.ino file on the MKR GSM 1400:
🌊🚱 The device waits for the MKR GSM 1400 to connect to the GSM network.
🌊🚱 If the MKR GSM 1400 connects to the GSM network successfully, the device turns the RGB LED to blue and prints (also inverts) this message on the screen:
GSM: Connected successfully to the GSM network!
🌊🚱 After soaking water quality sensors in a sample from a water resource, the device displays the collected water quality data of that sample on the screen:
🌊🚱 If the control button (2) is pressed, the device runs inference with the Neuton model by employing the most recently generated ORP, pH, TDS, and turbidity measurements as the input.
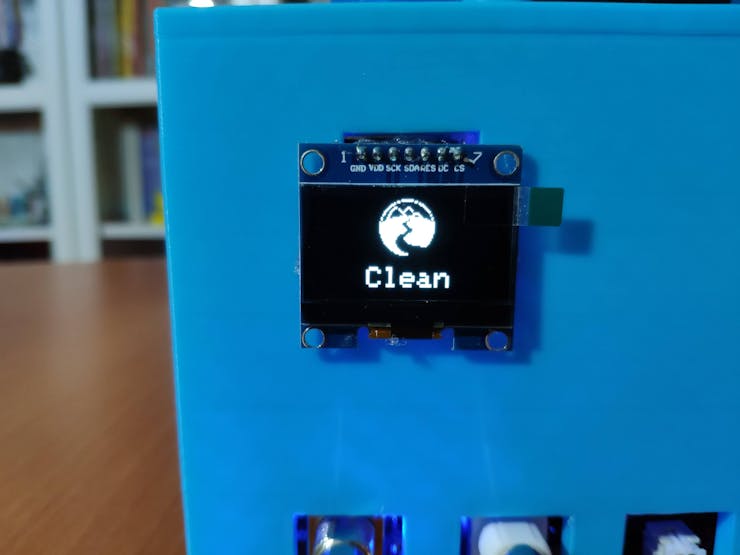
🌊🚱 Then, the device displays the output (detection result), which represents the most accurate label (water pollution class) predicted by the model.
🌊🚱 Each water pollution level (class) has a unique monochrome icon to be shown on the screen and color code for the RGB LED when being detected as the output:

🌊🚱 Then, after running inference successfully, the device transmits the prediction (detection) result via SMS to a given mobile number.
🌊🚱 If the MKR GSM 1400 transfers the SMS message successfully, the device blink_s the RGB LED as green and prints (also inverts) this message on the screen:
GSM: SMS is transferred to the given mobile number successfully!
🌊🚱 Also, the device prints notifications and sensor measurements on the serial monitor for debugging.
As far as my experiments go, the device operates impeccably while forecasting water pollution levels (classes) and transmitting the prediction result via SMS in the field :)
After completing all steps above and experimenting, I have employed the device to predict and detect water pollution levels of various water resources (supplies) in the field so as to track pollution locally to get prescient warnings regarding possible health and environmental risks.
By applying neural network models trained on ORP, pH, TDS, and turbidity measurements in detecting water pollution levels while experimenting in the field, we can achieve to:
🌊🚱 take the necessary precautions to protect wildlife, marine life, plants, and the environment,
🌊🚱 prevent diseases instigated and amplified by contaminated drinking water,
🌊🚱 detect industrial effluents discharged into water bodies,
🌊🚱 avoid progressive eutrophication.
Credit: water-pollution.org.uk
[1] Melissa Denchak, Water Pollution: Everything You Need to Know, NRDC (Natural Resources Defense Council), May 2018, https://www.nrdc.org/stories/water-pollution-everything-you-need-know.
[2] https://www.enr.gov.nt.ca/sites/enr/files/oxidation-reduction_potential.pdf.
[3] pH in Drinking-water, WHO Guidelines for Drinking-water Quality, World Health Organization, 2007, https://www.who.int/water_sanitation_health/dwq/chemicals/ph_revised_2007_clean_version.pdf.
[4] Total dissolved solids in Drinking-water, WHO Guidelines for Drinking-water Quality, World Health Organization, 2003, https://www.who.int/water_sanitation_health/dwq/chemicals/tds.pdf.
[5] Acceptability aspects: Taste, odour and appearance, Guidelines for Drinking-water Quality, Fourth Edition, World Health Organization, 2011, https://www.who.int/water_sanitation_health/publications/2011/9789241548151_ch10.pdf.

|
arduino IDEArduino
|
|
|
|
Neuton Tiny ML Neuton |
|

|
Raspbian OSRaspberry Pi
|
|

|
Autodesk Fusion 360Autodesk
|
|

|
Ultimaker CURA |
|

|
Microsoft Visual Studio |